Download
1 / 42
420 likes | 438 Views
Explore the contributions of genetic and environmental factors to BMI variance across different groups, addressing quantitative and qualitative differences. Conduct various models and exercises for assessing heterogeneity and homogeneity in males and females.

E N D
Heterogeneity Hermine Maes TC19 March 2006
Files to Copy to your Computer • Faculty/hmaes/tc19/maes/heterogeneity • ozbmi.rec • ozbmi.dat • ozbmiysat(4)(5).mx • ozbmiyace(4)(eq)(5).mx • Heterogeneity.ppt
Heterogeneity Questions I • Univariate Analysis: What are the contributions of additive genetic, dominance/shared environmental and unique environmental factors to the variance? • Heterogeneity Analysis: Are the contributions of genetic and environmental factors equal for different groups, such as sex, race, ethnicity, SES, environmental exposure, etc.?
Heterogeneity Questions II • Are these differences due to differences in the magnitude of the effects (quantitative)? • e.g. Is the contribution of genetic/environmental factors greater/smaller in males than in females? • Are the differences due to differences in the nature of the effects (qualitative)? • e.g. Are there different genetic/environmental factors influencing the trait in males and females?
Heterogeneity Females Males
#NGroups 8 G1: female parameters af, ef, df G2: MZF data m1, m2 G3: DZF data m3, m4 G4: female standardized estimates G5: male parameters am, em, dm G6: MZM data m5, m6 G7: DZM data m7, m8 G8: male standardized estimates Heterogeneity Script Move Start Statements to Last Group
Models for Concordant Pairs EP: estimated parameters df=6
Exercise I • Run Saturated Model • ozbmiysat4.mx • Run Heterogeneity Model • ozbmiyade4.mx
Exercise II • Run Homogeneity model • Equate af=am • Equate ef=em • Equate df=dm
#NGroups 6 G1: parameters a, e, d G2: MZF data m1, m2 G3: DZF data m3, m4 G4: MZM data m5, m6 G5: DZM data m7, m8 G6: standardized estimates Homogeneity Script ozbmiyade4eq.mx
Models for Concordant Pairs EP: estimated parameters df=9 df=3
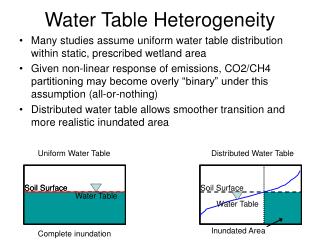
What about DZO? • Var F, Cov MZF, Cov DZF • af, df, ef • Var M, Cov MZM, Cov DZM • am, dm, em • Var Fdzo = Var F, Var M dzo = Var M • Cov DZO • rg
Exercise III • Extend Saturated model to 5 groups • from ozbmiysat4.mx
Goodness-of-Fit Statistics forBMI in young females+males+DZO
Goodness-of-Fit Statistics forBMI in young females+males+DZO
Summary of Models • General Sex Limitation Model: • quantitative and qualitative differences • Heterogeneity Model: • quantitative but no qualitative differences • Homogeneity Model: • no quantitative, no qualitative differences
! Estimate variance components - ACED model! OZ BMI data - young females & males + opp sex • #NGroups 7 • #define nvar 1 • #define nvar2 2 • G1: Parameters • Calculation • Begin Matrices; • X Lower nvar nvar Free ! FEMALES a • Y Lower nvar nvar ! FEMALES c • Z Lower nvar nvar Free ! FEMALES e • W Lower nvar nvar Free ! FEMALES d • S Lower nvar nvar Free ! MALES a • T Lower nvar nvar ! MALES c • U Lower nvar nvar Free ! MALES e • V Lower nvar nvar Free ! MALES d • H Full 1 1 ! scalar, 0.5 • Q Full 1 1 ! scalar, 0.25 • F Full 1 1 Free ! free for DZO • End Matrices;
Group 1 continued • Matrix H .5 • Matrix Q .25 • Start 1 F 1 1 1 • Bound 0 1 F 1 1 1 • Begin Algebra; • A= X*X'; ! FEMALES a^2 • C= Y*Y'; ! FEMALES c^2 • E= Z*Z'; ! FEMALES e^2 • D= W*W'; ! FEMALES d^2 • K= S*S'; ! MALES a^2 • L= T*T'; ! MALES c^2 • N= U*U'; ! MALES e^2 • O= V*V'; ! MALES d^2 • End Algebra; • End
Title G2: MZf data #include ozbmi2.dat Select if zyg =1 Select if agecat =1 Select bmi1 bmi2 ; Begin Matrices = Group 1; M Full 1 nvar2 Free End Matrices; Means M; Covariance A+C+E+D | A+C+D _ A+C+D | A+C+E+D; Option RSiduals; End Title G3: DZf data #include ozbmi2.dat Select if zyg =3 Select if agecat =1 Select bmi1 bmi2 ; Begin Matrices = Group 1; M Full 1 nvar2 Free End Matrices; Means M; Covariance A+C+E+D | H@A+C+Q@D _ H@A+C+Q@D | A+C+E+D; Option RSiduals End Groups 2 & 3
Title G4: MZm data #include ozbmi2.dat Select if zyg =2 Select if agecat =1 Select bmi1 bmi2 ; Begin Matrices = Group 1; M Full 1 nvar2 Free End Matrices; Means M; Covariance K+L+N+O | K+L+O _ K+L+O | K+L+N+O ; Option RSiduals; End Title G5: DZm data #include ozbmi2.dat Select if zyg =4 Select if agecat =1 Select bmi1 bmi2 ; Begin Matrices = Group 1; M Full 1 nvar2 Free End Matrices; Means M; Covariance K+L+N+O | H@K+L+Q@O _ H@K+L+Q@O | K+L+N+O ; Option RSiduals End Groups 4 & 5
Group 6: DZO • Title G6: DZfm data • #include ozbmi2.dat • Select if zyg =5 • Select if agecat =1 • Select bmi1 bmi2 ; • Begin Matrices = Group 1; • M Full 1 nvar2 Free • End Matrices; • Means M; • Covariance • A+C+E+D | F@H@(X*S')+(Y*T')+F@Q@(W*V') _ • F@H@(S*X')+(T*Y')+F@Q@(V*W') | K+L+N+O ; • Option RSiduals • End Variance females Variance males
Group 7 • Title G7: Standardization • Calculation • Begin Matrices = Group 1; • Start .5 all • Start 20 M 2 1 1 - M 2 1 nvar2 • Start 20 M 3 1 1 - M 3 1 nvar2 • Start 20 M 4 1 1 - M 4 1 nvar2 • Start 20 M 5 1 1 - M 5 1 nvar2 • Start 20 M 6 1 1 - M 6 1 nvar2 • Begin Algebra; • G= A+C+E+D; ! FEMALES total variance • J= K+L+N+O; ! MALES total variance • P= A%G| C%G| E%G| D%G_ ! FEMALES stand variance components • K%J| L%J| N%J| O%J; ! MALES stand variance components • End Algebra; • Option NDecimals=4 • !ADE model • Option Sat=8310.308, 3633 • Option Multiple • End
Submodels • Last Group • Option Sat=8310.308, 3633 • Option Multiple • End • Option Issat • End • ! Test for qualitative sex differences (nature of effect) • Drop @1 F 1 1 1 ! drop rg • End • Option Issat • End • ! Test for quantitative sex differences (magnitude of effect) • Equate X 1 1 1 S 1 1 1 ! a_f = a_m • Equate Z 1 1 1 U 1 1 1 ! e_f = e_m • Equate W 1 1 1 V 1 1 1 ! d_f = d_m • End
Exercise IV • Run Sex Limitation Model on 5 groups • ozbmiyade5.mx
Goodness-of-Fit Statistics forBMI in young females+males+DZO