Download
1 / 16
160 likes | 286 Views
Demography of southern leatherside chub in the presence and absence of an introduced predator. Mark C. Belk, Eric Billman, Josh Rasmussen, Karen Mock, Jerald B. Johnson. Predation – complex effects, experimental approaches. Transition matrix – a powerful tool. Vital rates and matrix methods

E N D
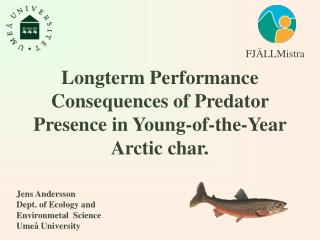
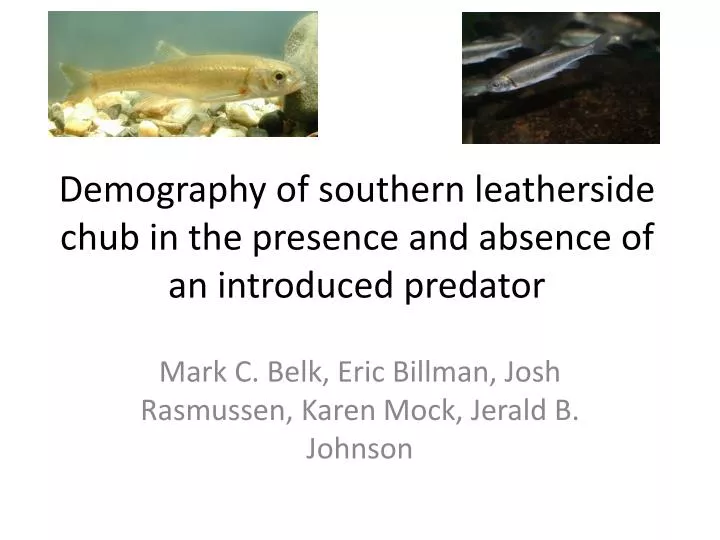
Demography of southern leathersidechub in the presence and absence of an introduced predator Mark C. Belk, Eric Billman, Josh Rasmussen, Karen Mock, Jerald B. Johnson
Transition matrix – a powerful tool • Vital rates and matrix methods • Combine matrix models with predation experiments • Unravel ecological and evolutionary consequences of predation
Southern leatherside chub (Lepidomedaaliciae) serial mark-recapture experiment on two populations of southern leatherside chub – one that co-occurs with introduced brown trout and one without
Stage-structured model • Serial mark-recapture, 2 locations, 3-4 years, • 3-stages based on size and maturity • Fecundity estimates based on independent samples • Pre-breeding census model, s0, survival of offspring from birth to first counting (1 year), applied to fecundity estimates
Three questions • Are there detectable differences in mortality rate between brown trout and non-brown trout environments? • What are population demographic consequences of brown trout predation? • Which vital rates have the greatest impact on population growth and fitness?
Survival estimates No-predator – Salina Creek Predator – Lost Creek s0 = 0.0014 s0 = 0.0033
Life cycle and transition matrix F2 F3 1 2 G1,2 G1 G2 3 S3 S2 S1
Transition matrices No-predator, Salina Creek Predator, Lost Creek
Growth rates of individuals Billman et al. 2011, Eco. Fresh. Fish
Elasticity analysis No-predator, Salina Creek Predator, Lost Creek
Conclusions • Are there detectable differences in mortality rate between brown trout and non-brown trout environments? • YES. Pattern is stage-specific and alternates • What are population demographic consequences of brown trout predation? • change in λ, stable stage distribution, T • mainly through modification of growth rates (G) and the s0 component of fecundity.
Conclusions • Which vital rates have the greatest impact on population growth and fitness? • Early growth and fecundity contribute most to population growth and fitness
Application • For fisheries, humans act as predator • Potential for strong ecological effects • Introduced fish • Population demography as tool • e.g. effect of burbot on important fisheries species • Native species conservation • Effect of introduced species • Effect of habitat degradation • Interacting effects