Download

1 / 0
0 likes | 183 Views
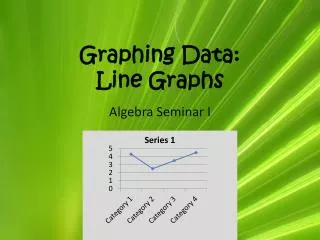
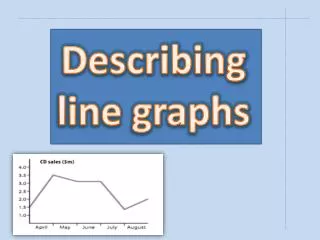
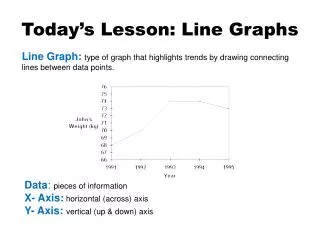
Line Graphs . ...and when to use them. Line Graph . A line graph shows data that change over time. This graph shows, how the number of hours teens spent listening to the radio each week, changed from 1998 to 2003. Line Graph .

E N D