Download
1 / 7
150 likes | 435 Views
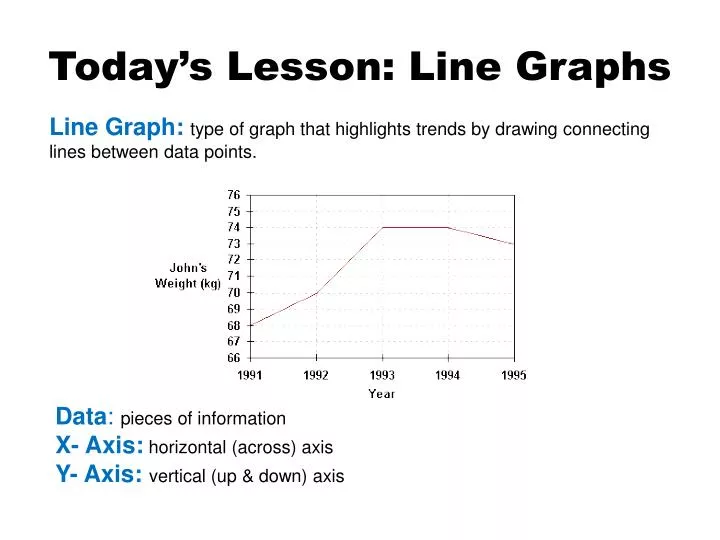
Today’s Lesson: Line Graphs. Line Graph: type of graph that highlights trends by drawing connecting lines between data points. Data : pieces of information X- Axis: horizontal (across) axis Y- Axis: vertical (up & down) axis. Today’s Lesson: Line Graphs.

E N D
Today’s Lesson: Line Graphs Line Graph: type of graph that highlights trends by drawing connecting lines between data points. Data: pieces of information X- Axis: horizontal (across) axis Y- Axis: vertical (up & down) axis
Today’s Lesson: Line Graphs Double line graphs: allow people to compare two sets of data over time
Today’s Lesson: Line Graphs • Trend: general direction in data • ** To determine a trend: • If the part of a line between two points is risingfrom left to right, the data numbers are increasing. • If the part of a line between two points is fallingfrom left to right, the data numbers are decreasing. Example of an increasing trend:
How to make a line graph: Step 1: Decide on a scale and its intervals. Draw the graph. Label the axes. Step 2: Graph the data by plotting the points. Step 3: Connect the points for each set of data. Step 4: Title your graph. Miss. B’s Earnings
Line Graphs Favorite Cereal