Download
1 / 4
40 likes | 163 Views
Market Analysis: Advertising Turnover. ASA Advertising Turnover ($M) – 10 Year Trend 1997 to 2006 Figures include national, retail and classified advertising. Newspapers $810 (-2.4%). TV $641 (-3.8%). Magazines $251 (-3.5%). Radio $269 (+5.1%). Online $65 (+47.7%).

E N D
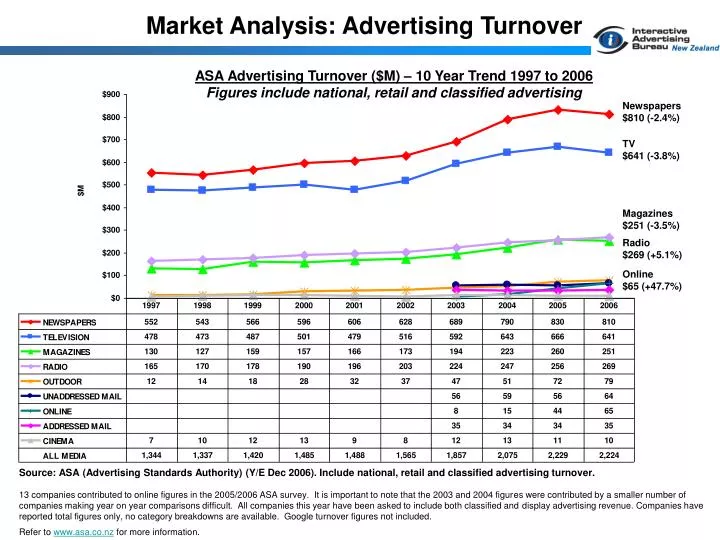
Market Analysis: Advertising Turnover ASA Advertising Turnover ($M) – 10 Year Trend 1997 to 2006 Figures include national, retail and classified advertising Newspapers $810 (-2.4%) TV $641 (-3.8%) Magazines $251 (-3.5%) Radio $269 (+5.1%) Online $65 (+47.7%) Source: ASA (Advertising Standards Authority) (Y/E Dec 2006). Include national, retail and classified advertising turnover. 13 companies contributed to online figures in the 2005/2006 ASA survey. It is important to note that the 2003 and 2004 figures were contributed by a smaller number of companies making year on year comparisons difficult. All companies this year have been asked to include both classified and display advertising revenue. Companies have reported total figures only, no category breakdowns are available. Google turnover figures not included. Refer to www.asa.co.nz for more information.
Market Analysis: Advertising Turnover ASA Advertising Turnover ($M) – 10 Year Trend 1997 to 2006 Figures include national, retail and classified advertising Source: ASA (Advertising Standards Authority) (Y/E Dec 2006). Include national, retail and classified advertising turnover. 13 companies contributed to online figures in the 2005/2006 ASA survey. It is important to note that the 2003 and 2004 figures were contributed by a smaller number of companies making year on year comparisons difficult. All companies this year have been asked to include both classified and display advertising revenue. Companies have reported total figures only, no category breakdowns are available. Google turnover figures not included. Refer to www.asa.co.nz for more information.
Market Analysis: Advertising Turnover ASA Advertising Turnover (Media Share %) Figures include national, retail and classified advertising +0.1% +0.4% +0.9% -0.1% +0.4% 2005 All Media $2,229M 2006 All Media $2,224M -0.8% -0.4% +0.6% -1.1% Source: ASA (Advertising Standards Authority) (Y/E Dec 2006). Include national, retail and classified advertising turnover. 13 companies contributed to online figures in the 2005/2006 ASA survey. It is important to note that the 2003 and 2004 figures were contributed by a smaller number of companies making year on year comparisons difficult. All companies this year have been asked to include both classified and display advertising revenue. Companies have reported total figures only, no category breakdowns are available. Google turnover figures not included. Refer to www.asa.co.nz for more information.
Market Analysis: Advertising Turnover ASA Advertising Turnover ($M) Figures include national, retail and classified advertising Source: ASA (Advertising Standards Authority) (Y/E Dec 2006). Include national, retail and classified advertising turnover. 13 companies contributed to online figures in the 2005/2006 ASA survey. It is important to note that the 2003 and 2004 figures were contributed by a smaller number of companies making year on year comparisons difficult. All companies this year have been asked to include both classified and display advertising revenue. Companies have reported total figures only, no category breakdowns are available. Google turnover figures not included. Refer to www.asa.co.nz for more information.