Download
1 / 28
280 likes | 299 Views
This study presents measurements on the UK TM Stave Prototype, focusing on static out-of-plane deflections and normal modes. The stave is mounted vertically to an All-Indium panel with temperature sensors on both sides. The distortion of the panel due to temperature differential is measured, and capacitive displacement sensors are used to monitor the silicon surface. The stave is cooled using a blow-off CO2 system, and the effects of cooling and power on the stave's movements are observed. Modules are found to be debonded in some areas, affecting the stability of the measurements.

E N D
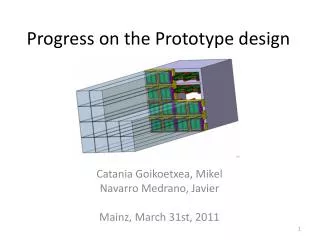
Some ESPI Measurements on the UK TM Stave Prototype Static Out-of-plane deflections Normal Modes
Mounting and static-deflection set-up Stave is mounted vertically to an All-Indium panel with temperature sensors both sides Distortion of panel measured due to temperature differential between sides 60C differential gives ~8microns bend to panel Capacitive displacement sensors watch front-face silicon in six locations Mounted to indium/aluminium bridges which attach to the indium panel Cooling is supplied by blow-off CO2 system pipes and cables from rhs Small (relatively) distortion arises on turn-on of cooling, which depends on strain-relief
Invar plate distortion with a ~45Clocal temperature differential front-back
Front Invar panel temperatures during cooling test reported Rear Temperatures Differential is never more than 6C Invar Panel is not driving movements in stave
This is the distortion in the stave caused by applying theCO2 gas back-pressure. A continuous surface distortion ~10microns note that top left mounting was ‘incorrect’
Top 1 Top 3 Top 5 Bottom 2 Bottom 4 Bottom 6 The displacement sensors are located as shown: A +ve displacement is movement away from sensor (into page) Conversely a negative is movement towards Left undisturbed the sensors readings remain stable to ~1mm When cooling or power is applied the stave moves in a waythat ESPI does not follow over extended periods (>2 seconds) Movement is jumpy?, but displacement sensors give ‘sensible’ readings and after entire cycle return to same values within a few microns
Top Left Middle Right Bottom Left Middle Right Data Run with sensor overlapping edges of Modules Time in mins Temp Cooling on = 10 Cooling flow = 5 Cooling off Power = 120W Power = 0
Top 1 Top 3 Top 5 Bottom 2 Bottom 4 Bottom 6 Hard to believe the out-of-plane top left fixationis working ‘well’. motions relative to starting positions
Modules found to be debonded in some places The ‘L’ shapes at the bottom edge line up with the edges of modules. When pressed these prove to be detached from the surface of the stave. This data is from 26/1/12 RUN 8 out of plane, when the gas pressure applied
Modules found to be debonded in some places L L L The ‘L’ shapes at the bottom edge line up with the edges of the 5th,6th,7thmodules from the lhs. When pressed these prove to be detached from thesurface of the stave. The module in ‘5th’ position from left moves by about 1/2mm This data is from 26/1/12 RUN 8 out of plane, when the gas pressure applied
Top Left Middle Right Bottom Left Middle Right Data Run with sensor overlapping edges of Modules Time in mins Temp Cooling on = 10 Cooling flow = 5 Cooling off Power = 120W Power = 0
Top Left Middle Right Bottom Left Middle Right Data run with sensors displaced to centre of modules Time in minutes Gas On Liquid arrives Cooling Off Cooling Exhausted
Sensor 1 – silicon middle in from edge Sensor 2 – silicon middle in from edge Sensor 3 - carbon fibre just off module Sensor 4 – silicon middle edge of module Sensor 5,6 unchanged 1 3 5 2 4 6 At location 4silicon seems to bewell bonded by visual inspection m Cooling off Carbon measure maybe affected by proximityto edge of stave - will check Cooling P=0W P=120W
Example of movement in 1.2s during period before liquid arrives after cooling is turned on, but before liquid arrives at stave. [?tbc]
Example of change in 0.8s during period when P=60W It is possible that parts are still moving too fast to see at all.Jumps seem another possibility. NB the invar baseplate moves and this is a clear uniform motion(but over much longer time scales than 1.2s) - not at all similar to the apparent behaviour of the stave.
Updated Conclusions on Static behaviour • Stave Movement during cooling/powering is • typically less than 50mm out of plane • repeatable to within ~fewmm [possibly measurement limitation] • Is smooth when the gas pressure applied – surface visible with ESPI • Modules are apparently not well bonded ‘locally’ to the stave, causingspurious measurements and ESPI difficulty • Cold-unpowered to cooled is biggest change • Applying power brings the stave partially back to uncooled state • No evidence yet that single edge mounting contributory to size of movement (both edges seem to move the same way & same distance ?)
Stave excited with sound 900W amplifier, 2 x 300W speakers [one used as table] Estimate <100W sound delivered from a range of 1.5m Note that wavelength of sound at 60Hz is around 5m 240Hz will be <1.5m This is not an ideal excitation method
Measurement with loose top left (bottom right!) mount (Using different speakers) Mode shapes expected if the stave is mounted in a standard configuration and without any loose contact at the locks 1st mode FEA f2 / f1 = 1.24; f3/f2 = 1.27 2nd mode FEA 104Hz 3rd mode FEA 164Hz
Measurement with top left fixation tight (bottom right in below) f2 / f1 = 1.24; f3/f2 = 1.27 1st mode ~60Hz Approx 60Hz 2nd mode Freq 107.76 108Hz 3rd mode
Stave exhibits other modes, eg: above 118Hz
The Q of the stave seems high, resonances have a width <4Hz Q is probably >20 • Early Conclusions on Resonant Behaviour • Stave exhibits resonant behaviour similar to ‘basic’ FEA expectation • Lowest resonance is ~58Hz in current mounting scheme • Q is high • Behaviour is quite complicated