Download
1 / 7
70 likes | 157 Views
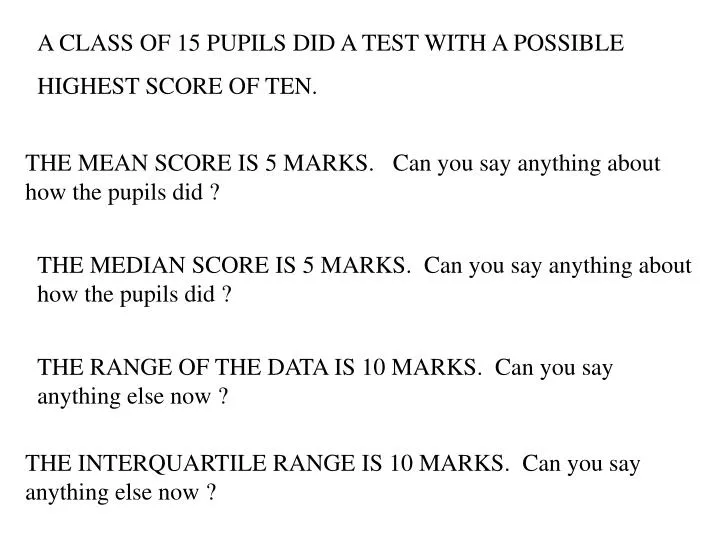
A CLASS OF 15 PUPILS DID A TEST WITH A POSSIBLE HIGHEST SCORE OF TEN. THE MEAN SCORE IS 5 MARKS. Can you say anything about how the pupils did ?. THE MEDIAN SCORE IS 5 MARKS. Can you say anything about how the pupils did ?.

E N D
A CLASS OF 15 PUPILS DID A TEST WITH A POSSIBLE HIGHEST SCORE OF TEN. THE MEAN SCORE IS 5 MARKS. Can you say anything about how the pupils did ? THE MEDIAN SCORE IS 5 MARKS. Can you say anything about how the pupils did ? THE RANGE OF THE DATA IS 10 MARKS. Can you say anything else now ? THE INTERQUARTILE RANGE IS 10 MARKS. Can you say anything else now ?
What other average could we have found that would help ? Here is the data 0,0,0,0,0,0,0,5,10,10,10,10,10,10,10 10 0 0 1 2 3 4 5 6 7 8 9 10 Were your mean and median representative of the data as a whole ? Did the range or the interquartile range help you the most ?
The following data has three of the mean, median, range, interquartile range the same as the other data. Which three are the same ? Which is different. What is different about this data ? Scores of pupils 0,1,2,3,4,5,6,7,8,9,10 5 0 1 2 3 4 5 6 7 8 9 10 Mean, median and range the same – IQR different (LQ 2, UQ 8 so IQR is 6 – smaller than last time)
The following data has the same mean, median and range as the last two sets. What do you think will happen to the interquartile range this time ? 0,4,4,5,5,5,5,6,6,10 0 1 2 3 4 5 6 7 8 9 10 The LQ is now 4 and the UQ is 6 so the IQR range is down to 2. How has the distribution of scores changed ?
When most of the data values are grouped closely around the median then the interquartile range is relatively lower than if they are equally spread out throughout the range or our grouped at either end. When the data is closer to the lower quartile most of the data values are at the lower end of the range and we say the distribution has POSITIVE SKEW When the data is closer to the upper quartile most of the data values are at the higher end of the range and we say that the distribution has NEGATIVE SKEW When the median is mid way between the upper and lower quartiles the distribution is SYMMETRICAL
Most of data at lower end POSITIVE SKEW Most of the data is at the upper end NEGATIVE SKEW
The data is equally spread either side of the middle IT IS A SYMMETRICAL DISTRIBUTION