Download
1 / 14
140 likes | 319 Views
“El Gordo,” Multi-wavelength Observations. CMB. Optical+ X-ray. X-ray. Menanteau et al. (2012). Detected in 2008 ACT maps of Southern Strip (Menanteau et al. 2010, Marriage et al. 2011) Strongest SZ decrement over 755 deg 2 (South + Equator) Optical follow-up: 89 redshifts!

E N D
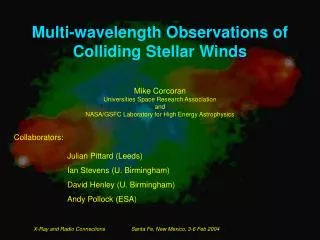
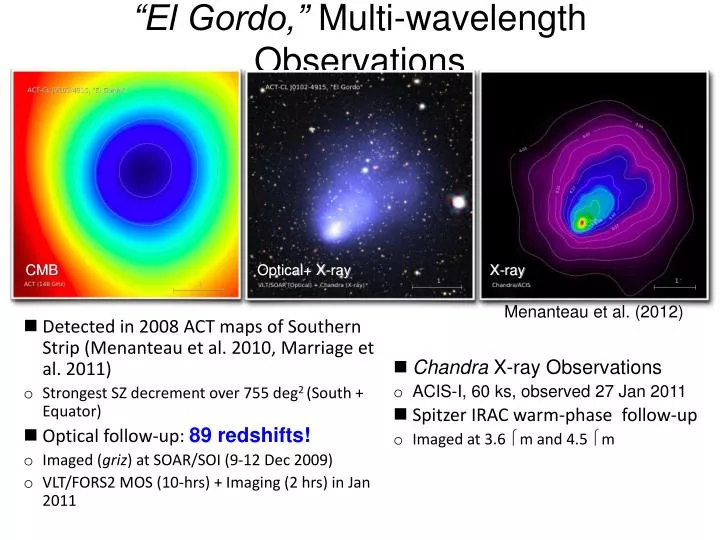
“El Gordo,” Multi-wavelength Observations CMB Optical+ X-ray X-ray Menanteau et al. (2012) • Detected in 2008 ACT maps of Southern Strip (Menanteau et al. 2010, Marriage et al. 2011) • Strongest SZ decrement over 755 deg2 (South + Equator) • Optical follow-up: 89 redshifts! • Imaged (griz) at SOAR/SOI (9-12 Dec 2009) • VLT/FORS2 MOS (10-hrs) + Imaging (2 hrs) in Jan 2011 • Chandra X-ray Observations • ACIS-I, 60 ks, observed 27 Jan 2011 • Spitzer IRAC warm-phase follow-up • Imaged at 3.6 μm and 4.5 μm
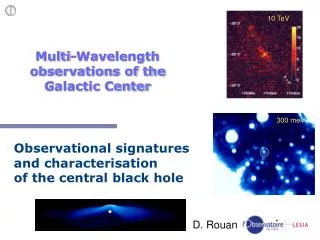
The well-known Bullet Cluster Clowe et al.(2006)
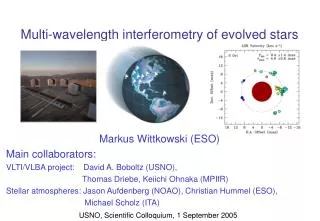
The galaxies in “El Gordo” mostly lie in two distinct groups Gas Peak z=0.87 The X-ray emission mostly lies between these two groups and shows a peculiar structure with a bright offset Gas Peak and Wake. 2nd Peak of Galaxies 1st Peak of Galaxies The peak of the Galaxy distribution precedes the Gas Peak in the direction of the merger – a spatial separation like that seen in the Bullet Cluster. A Violent Merger in “El Gordo” • Highlights on “El Gordo” • Optically confirmed in the 2009B (Menanteau et al. 2010) • The highest SZ signal from ACT (~755 deg2 ,Marriage et al. 2011) • The hottest cluster at z>0.6 • The most massive and X-ray Luminous cluster at z>0.6 • 89 redshifts from VLT (dynamical mass, σgal-M) • Chandra/ACIS observations (X-ray mass, Lx-M, Tx-M, Yx-M) • Spitzer/IRAC 3.6um and 4.5um (Stellar mass) • Clear “wake” in the X-ray surface density. • Separation between hot gas and galaxies of ~22 arcsec (~173 kpc) Wake The offset peak is likely the core of one of the merging components; arrow indicates the approximate direction of merger. Menanteau et al. (2012, ApJ, 748,7)
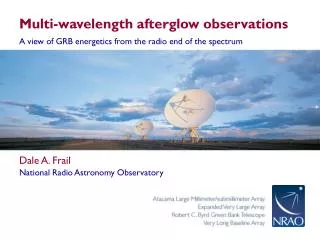
“El Gordo” is Hot and Luminous!! Menanteau et al. (2012, ApJ, 748,7) Core-excised Integrated spectrum Compared with Markevitch et al. (1998)
VLT FORS2 (Jan 2011, 10hrs), redshifts for 89 members: • Combined (χ2 combined) optical+X-ray+SZ: • Chandra/ACIS (Jan 2011, 60 ks exposure): • ACT/SZ decrement, yTCMB - Mass CL J1226+3332 (z=0.89) Kravtsov, Vikhlinin & Nagai (2006) Vikhlinin et al. (2009) SPT-CL J2106-5844 (z=1.14) Sehgal et al. (2011) Evrard et al. (2008) Combined measurements for the Most Massive Cluster at z>0.6 Menanteau et al. (2012, ApJ, 748,7)
Unlikely Likely Rarity of “El Gordo” (Based on its exceptional mass) Menanteau et al. (2012, ApJ, 748,7) • Combined Mass from optical+X-ray+SZ: • Area of survey: ACT: 755 deg2 ACT+SPT: 2800 deg2 • Mortonson et al. (2011) exclusion curves for ΛCDM and quintenssence parameter distribution. (“El Gordo”) • Cluster is very unlikely in the ACT survey area alone (3σ), but still allowed in the ACT+SPT sky region if its mass is 1-σ or more below the nominal mass.
Low entropy, bright, offset peak Steep brightness gradient Wake! Cometary shape (even 2 tails!) 20-40% surface brightness suppression ≈35”x60” β model profile “El Gordo,” Chandra Imaging Menanteau et al. (2012, ApJ, 748,7)
Chandra Spectro-Imaging Analysis Menanteau et al. (2012, ApJ, 748,7) Divide cluster in six regions based on surface brightness Region 1 : 1000 cts Region 4 : 4300 cts Others : 2000 – 3600 cts
- X-ray peak is cold (kT=6.6±0.7 keV) - Highest Fe abundance (Z=0.57±0.20) - low entropy bullet, i.e., the cool core of a merging cluster Chandra Spectro-Imaging Analysis Menanteau et al. (2012, ApJ, 748,7) Total Coldest
Hottest region is kT=22(+6,-5) keV (source frame) – shock heating? Chandra Spectro-Imaging Analysis Menanteau et al. (2012, ApJ, 748,7) Total Hottest
Chandra Spectro-Imaging Analysis Menanteau et al. (2012, ApJ, 748,7)
(NW) (SE) Very luminous BCG Mass ratio ~ 2 to 1 No such high-z mergers find in current large N-body Simulations (Cube3pm) A new bullet at z=0.87? Menanteau et al. (2012, ApJ, 748,7)
Angstroms • BCG is an E+A+[OII] galaxy (not red and dead) • Similar to NGC 1275 in Perseus Clusters (McNamara 1996) and RXJ 1347 (z=0.45) • The BCG sample in Donahue et al.(2010), ApJ 715, 881 Color-magnitude for ACT-CL J0102-4915 Optical colors Menanteau et al. (2012, ApJ, 748,7)
Spitzer/Stellar Mass Content - Use g,r,i,z + Spitzer/IRAC 3.6um, 4.5um to estimate stellar mass content from SED fits (BC03) Menanteau et al. (2012, ApJ, 748,7)