Download
1 / 63
660 likes | 878 Views
Introduction to Econometrics. The Statistical Analysis of Economic (and related) Data. Brief Overview of the Course. This course is about using data to measure causal effects. In this course you will:. Review of Probability and Statistics (SW Chapters 2, 3).

E N D
Introduction toEconometrics The Statistical Analysis of Economic (and related) Data
Initial look at the data:(You should already know how to interpret this table) • This table doesn’t tell us anything about the relationship between test scores and the STR.
Do districts with smaller classes have higher test scores? Scatterplot of test score v. student-teacher ratio What does this figure show?
We need to get some numerical evidence on whether districts with low STRs have higher test scores – but how?
Initial data analysis: Compare districts with “small” (STR < 20) and “large” (STR ≥ 20) class sizes: 1. Estimation of = difference between group means 2. Test the hypothesis that = 0 3. Construct a confidence interval for
(b) Moments of a population distribution: mean, variance, standard deviation, covariance, correlation
The covariance between Test Score and STR is negative: so is the correlation…
The correlation coefficient is defined in terms of the covariance:
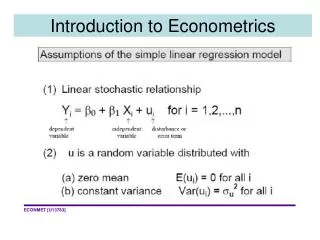
(d) Distribution of a sample of data drawn randomly from a population: Y1,…, Yn