Download
1 / 24
240 likes | 365 Views
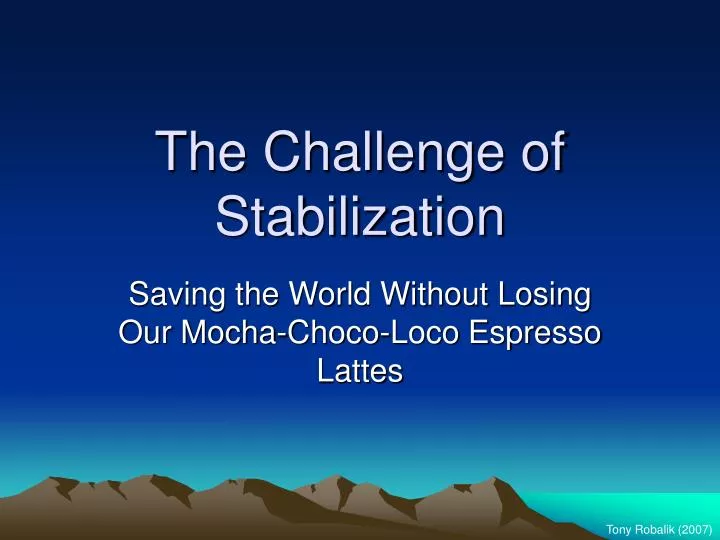
The Challenge of Stabilization. Saving the World Without Losing Our Mocha-Choco-Loco Espresso Lattes. Tony Robalik (2007). Dramatic Foreshadowing. Only the B1 SRES scenario “come[s] anywhere near to stabilization of concentration by 2100” (Houghton, p.254; Stern, p.177) B1 world is:

E N D
The Challenge of Stabilization Saving the World Without Losing Our Mocha-Choco-Loco Espresso Lattes Tony Robalik (2007)
Dramatic Foreshadowing • Only the B1 SRES scenario “come[s] anywhere near to stabilization of concentration by 2100” (Houghton, p.254; Stern, p.177) • B1 world is: • More integrated • More eco-friendly • Rapid economic growth, but towards service and info economy • Population peak of 9bn in 2050, then drops to 7bn by 2100 • Reduction in material intensity • Introduction of clean and efficient tech • Emphasis on global solutions to economic, social, and enviro sustainability • NO POLICY INTERVENTIONS • Our goal: to emit at a level consistent with natural CO2 sinks, i.e., no more than 5GtCO2e/yr (Houghton, p.254; Stern, p.193) http://en.wikipedia.org/wiki/SRES http://www.grida.no/climate/ipcc/emission/094.htm#1
Global Warming Potential (GWP) Note: CO2-equivalent emissions are defined differently than CO2-equivalent concentrations. Concentrations of CO2e consider the instantaneous effect of any particular gas in the atmosphere. For example, while non-CO2 gases account for only 23% of GWP, they account for 30% of total radiative forcing today. Stern prefers CO2e concentrations. Stern, 2006, p.198
~1850-2006 • 1850: atmospheric GHG concentrations were 280ppm CO2e • 2006: 430ppm CO2e • North America & Europe responsible for 70% of CO2 from energy production • Developing countries: less than 25% • Our national hypocrisy: • We’re the biggest culprits • We’ve exported all our manufacturing overseas Stern (2006)
Notice the slowdown in growth 1971-2002 associated with a real increase in prices Stern, 2006, p.175
Emissions per Capita • Assumed A1 or B1 scenario, in which world pop peaks at 9bn in 2050 and drops to 7bn by 2100 • Does not consider feedback effects • Not clear if Houghton is referring to CO2 or CO2e A transition economy is an economy which is changing from a planned economy to a free market (http://en.wikipedia.org/wiki/Transitional_economy) Houghton (2004), pp.255-7 Knickerbocker, 2007, citing Univ. of Chicago research
Feedback Effects • Two important feedbacks • Increased soil respiration as temp rises • Forest die-back as climate changes • Many stabilization scenarios do not consider these effects • If included: • 450ppm CO2 550ppm • 550ppm CO2 750ppm • Not clear if Houghton is referring to CO2 or CO2e • Currently, natural systems absorb ~1/2 anthropogenic CO2, but CC might change global carbon cycle, reducing this amount (Jones, 2006) (Houghton, 2006, p.255)
Emissions by Source • Greenhouse gas emissions by source, 2000 Stern (2006), p.171
Emissions Flowchart WRI: http://cait.wri.org/figures.php?page=World-FlowChart&view=100
Selected Sectors: Land-Use • Deforestation single largest source • Indonesia: 30% • Brazil: 20% Stern (2006), p.171, Annex 7f
Land Use • Peak in 1990 from forest fires in Indonesia • “Countries will halt deforestation when only 15% of their 2000 forest area remains”(Stern, Annex 7f, citing Houghton) • Houghton’s “arbitrary assumption” (id.) Stern (2006), p.171, Annex 7f
Land Use Stern, 2006, Annex 7f
Selected Sectors: Ag & the “Hidden” Sector • Developing countries: 75% of all ag emissions • Where do you think all your mangos and avacados come from? Stern, 2006, Annex 7g
When you include the entire supply chain, livestock account for 18% of all GHG emissions 9% of all CO2 37% of all CH4 (methane) 65% of all N2O (nitrous oxide) Includes, e.g., Deforestation for pasture & feed (70% of deforestation in Amazon grazing) Fertilizers Energy to run slaughterhouses & processing plants Etc. 30% of the Earth’s land surface is devoted to livestock Changes in dietary habits can have immediate effects, as turnover rate for farm animals is very short The “Hidden” Sector 18% of total CO2e cf. transport sector, which produces only 14% of total http://www.fao.org/newsroom/en/news/2006/1000448/index.html, 2007
“The affective system […] is the wellspring of action” (p.104) Visceral reactions, like fear and anxiety Personal experience is very important It functions automatically & without training, unlike the analytic system Recent events given more weight Evidence generated in favor of an action interferes with generation of evidence arguing against that action “[W]omen have been shown to worry more than men about a host of risks” (p.105) Worry is a finite resource One-action bias: worry goes away when just one action is taken Three policyrecommendations (p.116): High Drama: concretize future events and move them closer in time and space to raise visceral concern Improve process: need for “guided protocols by which decision makers consider arguments for conservation and climate change mitigation before they are allowed to consider arguments against such actions” Education & Eco-Literacy: “better (environmental) science and statistics education can create the familiarity with the scientific presentation of information and mental habits that will create citizens who give greater weight to the output of their analytic processing system” The problem is, of course, “ultimately self-corrective” (p.116) The Psychology of Worry Weber, 2006
Paths to Stabilization Clearly shows the benefits of peaking early Stern, 2006, p.199
Paths to Stabilization • Stabilization at 450ppm CO2e would be very difficult – but so lovely! • Stabilization at 550ppm CO2e (roughly double pre-ind) seems more “reasonable” Stern, 2006, p.200
CO2 and Temperature • “Maximum” and “minimum” are based on probabilities from “all eleven recent studies” • Note the significant probability of exceeding +3-4°C for 550ppm CO2e • 450ppm CO2e would be much safer, putting us in +2-3°C range • +2-3°C range is when Amazon goes bye-bye Stern, 2006, p.195 Warren, 2006
Income Population growth Fuel choice Affected by natural resource endowments “Historic investment in generation capacity” Sprawl, inefficient use of land Availability of alternatives (e.g., in transportation) Social choices (such as willingness to bike or walk) Dietary choices Carbon intensity Technical developments affecting fuel efficiency Economic growth --> rapid urbanization & infrastructure development Conversion of land from forest to agriculture Subsistence ag in Africa Beef & Soya in S. Am. Coffee & timber in S. Asia Increased ag productivity (more fertilizers and more N2O from the soil) Drivers of Emissions Growth Stern, 2006, Annexes 7b-g
STRONG POLICY Carbon capture and storage (CCS) Increased use of renewables Nuclear power If costs come down, and If “public acceptance issues are resolved” Switching to less carbon-intense FFs Reduced demand from end-users Improvements in fuel efficiency (could account for ¾ of carbon savings in transportation) Behavioral change Efficiency: Among IEA-11 group of countries, 10% reduction in energy demand accompanied 88% increase in manufacturing output (‘73-’00) Energy efficiency increases in buildings could come at low or negative costs Innovative design Good site design Better lighting, heaing, and cooling systems Save the forests! (and plant new ones) Dissemination of best practices in agriculture and forestry Stern’s Prospects for Savings Stern, 2006, Annexes 7b-g http://www.iea.org/Textbase/npsum/30YearsSUM.pdf IEA-11: Australia, Denmark, Finland, France, Germany, Japan, Italy, Norway, Sweden, the United Kingdom and the United States
“Wedges” This stabilizes emissions but notconcentrations Stern, 2006, p.207
B1 Scenario • The only SRES scenario that “come[s] anywhere near to stabilization of concentration by 2100” (Houghton, p.254; Stern, p.177) • How can we make it better? • What climate-specific policies should we implement? • What actions can planners & others take? http://www.grida.no/climate/ipcc/emission/094.htm#1
B1 Scenario • B1 world is: • More integrated • More eco-friendly • Rapid economic growth, but towards service and info economy • Population peak of 9bn in 2050, then drops to 7bn by 2100 • Reduction in material intensity • Introduction of clean and efficient tech • Emphasis on global solutions to economic, social, and enviro sustainability • WHAT POLICY INTERVENTIONS? • Our goal: to emit at a level consistent with natural CO2 sinks, i.e., no more than 5GtCO2e/yr (Houghton, p.254; Stern, p.193) http://en.wikipedia.org/wiki/SRES http://www.grida.no/climate/ipcc/emission/094.htm#1
References FAO. Livestock a major threat to environment: Remedies urgently needed. Retrieved 26 February 2007, from http://www.fao.org/newsroom/en/news/2006/1000448/index.html Knickerbocker, B. (20 February 2007). Humans’ beef with livestock: A warmer planet. Retrieved on 26 February 2007, from http://www.csmonitor.com/2007/0220/p03s01-ussc.html Houghton, J. (2004). Global warming: The complete briefing, 3rd Edition. Cambridge, UK: Cambridge University Press, pp.253-264. IEA. “Executive Summary”. Retrieved on 26 February 2007, from http://www.iea.org/Textbase/npsum/30YearsSUM.pdf Jones, C., Cox, P., & Huntingford, C. (2006). Impact of climate-carbon cycle feedbacks on emissions scenarios to achieve stabilization. In Schellnhuber (ed.), 324-331. “Special Report on Emissions Scenarios.” Retrieved on 26 February 2007, from http://en.wikipedia.org/wiki/SRES “SRES: B1 storyline and scenario family.” Retrieved on 26 February 2007, from http://www.grida.no/climate/ipcc/emission/094.htm#1 Stern, N. (2006). Stern Review on the Economics of Climate Change: Report to HM Treasury. Retrieved 24 February 2007, from http://www.hm-treasury.gov.uk/independent_reviews/stern_review_economics_climate_change/sternreview_index.cfm Warren, R. (2006). “Impacts of Global Climate Change at Different Annual Mean Global Temperature Increases.” In Schellnhuber (ed.), 93-131. Weber, E. (2006). Experience-based and description-based perceptions of long-term risk: Why global warming does not scare us (yet). Climatic Change 77: 103–120. WRI. World greenhouse gas emissions flow chart. Retrieved on 26 February 2007, from http://cait.wri.org/figures.php?page=World-FlowChart&view=100