Download
1 / 43
470 likes | 677 Views
The Open Ocean Environment: Plankton, Productivity and Food Webs of the Sea Chapters 7, 9, and 10. Plankton: Definitions.

E N D
The Open Ocean Environment: Plankton, Productivity and Food Webs of the Sea Chapters 7, 9, and 10
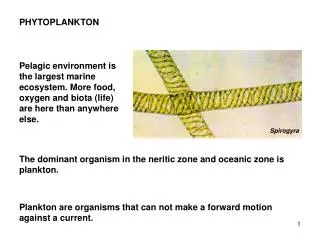
Plankton: Definitions • Plankton: organisms living in the water column, too small to be able to swim counter to typical ocean currents. This term refers to both animals and plants living in the water column.
Plankton: Definitions4 • Size classes
Phytoplankton (only plants) Diatoms • Occur singly or form chains • Size range of nanno to microplankton • Encased in silica shell consisting of two valves (pillbox) • Usually radially symmetrical • Reproduce asexually by binary fission • Also sexual reproduction • Doubling once or twice per day usually • Dominate the seas over the world.
Phytoplankton Dinoflagellates • Secrete organic test and have two flagellae • Size range of nanno and microplankton • Asexual and sexual reproduction • Often many life history stages • Many species are heterotrophic • Often abundant in tropics, mid-latitudes in summer • A few species are the cause of red tides
Red Tides Red tides are caused by an increase in nutrients in seawater that causes an increase in dinoflagellate populations. Species that cause red tides produce a neurotoxic substance, saxitoxin. This substance is dangerous to people. Shellfish (filter feeders) ingest the dinoflagellates and the toxin. Their tissues also become toxic.
Diatoms Dinoflagellates Coccolithophore Flagellate Isochrysis
Zooplankton Copepods Females of different species with eggs
Zooplankton Crustaceans - Euphausids (Krill)
Zooplankton Gelatinous Zooplankton - Cnidaria Note muscular bell and tentacles
Zooplankton Gelatinous Zooplankton - Cnidaria Porpita (ca. 10 cm wide) Physophora (50 mm high) By-the-wind-sailor Vellela Siphonophores
Zooplankton Gelatinous Zooplankton - Ctenophores
Patchiness of the Plankton • Plankton rarely distributed homogeneously in the water column • Plankton occur in spatially discontinuous patches, sometimes distinct aggregations • WHY?
Diurnal Vertical Migration of Zooplankton • Zooplankton rise to shallow water at night, sink to deeper water during the day • Found in many different groups of zooplankton • Zooplankters usually start to sink before dawn, and start to rise before dusk • Cycle is probably an internal biological clock that must be reinforced by day-night light changes
0 Night 100 200 Depth (m) Day 300 Twilight 400 0 1 2 3 Distance (km) Vertical migration of planktonic shrimp Sergia lucens
Review Questions: 1)Why does diurnal vertical migration occur? 2) Do plankton have high or low Reynolds numbers? Explain what a Reynolds number is. 3) How does plankton’s Reynolds number influence feeding in copepods? 4) Define the term drag in marine hydrodynamics. What adaptations do plankton have to decrease drag? 5) Why might it be important for plankton to stay in surface waters and not sink to great depths? 6) In some marine environments, copepods have strong diurnal migration and it others it is very weak. Why??
Critical Factors in Plankton Abundance Chapter 9
Spring Phytoplankton Increase(or Spring Diatom Increase) In midlatitudes, phytoplankton increase in the spring, decline in summer, and may increase to a lesser extent in fall. Question: What factors may cause these seasonal increases and declines?
Nutrients at surface Spring Diatom Increase Available sunlight Zooplankton Winter Spring Summer Fall Winter
Variations on the Spring Phytoplankton Increase The spring phytoplankton peak and the later zooplankton peak are shortest and sharpest in high latitudes, becoming indistinct in the tropics
Arctic Phytoplankton Herbivore zooplankton Temperate Phytoplankton Tropical Herbivore zooplankton Phytoplankton J F M A M J J A S O N D Month
Productivity and Food Webs in the SeaChapter 10 ©Jeffrey S. Levinton 2001
Productivity vs biomass Biomass the mass of living material present at any time, expressed as grams per unit area or volume Productivity is the rate of production of living material per unit time per unit area or volume
Productivity Primary productivity - productivity due to Photosynthesis. Secondary productivity - productivity due to consumers of primary producers.
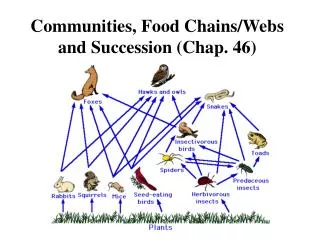
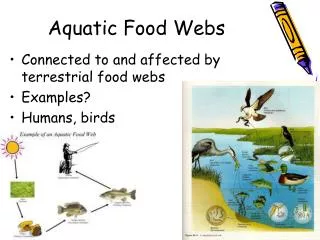
Food Chain Food chain - linear sequence showing which organisms consume which other organisms, making a series of trophic levels Food web - more complex diagram showing feeding relationships among organisms, not restricted to a linear hierarchy
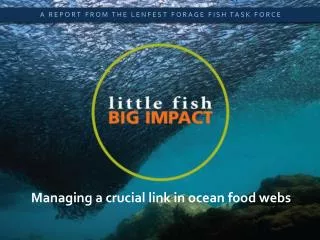
Food Chain Abstraction Food chain Food Web Adult herring Herring Young herring amphipod arrowworm sand eel Copepod Larger copepod cladocerans Mollusk larvae Barnacle larvae tunicate Small copepods euphausid Phytoplankton Phytoplankton
Transfer Between Trophic Levels Transfer from one trophic level to the next is not complete: 1. Some material not eaten 2. Not all eaten is converted with 100% efficiency. 3. 2% transferred from sunlight to primary producers; 10% transferred from primary producers, herbivores and up.
Oceanic Food Webs Food webs in the oceans vary systematically in food chain efficiency, number of trophic levels, primary production
Oceanic Food Webs Note: Great potential of upwelling areas due to combination of high primary production, higher food chain efficiency, lower number of trophic levels Why does lower number of trophic levels increase potential of production?
Oceanic Food Webs Open ocean, gyre centers Shelf, upwelling Many trophic levels Few trophic levels Stable, low nutrient Turbulent, high nutrient
North America North America Asia North Atlantic North Pacific Africa South America Indian Ocean South Pacific South Atlantic Antarctica Primary production (mg C/m2/day) <100 100-150 150-250 >250
Measuring Primary Productivity Gross primary productivity - total carbon fixed during photosynthesis Net primary productivity - total carbon fixed during photosynthesis minus that part which is respired.
Measuring Primary Productivity Satellite Approaches: Satellites can use photometers specific to wavelength to measure chlorophyll, Seawater temperature Need ground truthing to get relationship Between chlorophyll concentration and primary production; varies with region
sun Satellite Color scanner Irradiance Radiance Phytoplankton
Satellite image of world productivity, from SeaWiFS satellite
What’s in this image? How do sensors collect satellite images? What do the colors represent? How do we get these colors?
Images are always collected in black and white first. A computer then adds color.
A satellite image of this Red tide event helped researchers determine the concentrations of diatoms and toxins in the water.