Download
1 / 7
80 likes | 268 Views
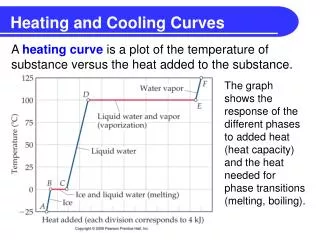
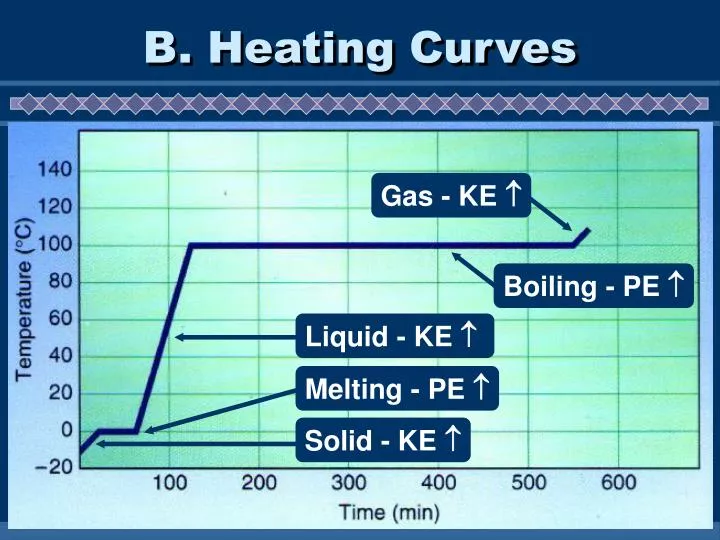
Gas - KE . Boiling - PE . Liquid - KE . Melting - PE . Solid - KE . B. Heating Curves. Squeeze Me!. Heating Curve = Energy Sponge Graph. All of the universe and its substances within in are ENERGY SPONGES

E N D
Gas - KE Boiling - PE Liquid - KE Melting - PE Solid - KE B. Heating Curves
Squeeze Me! Heating Curve = Energy Sponge Graph • All of the universe and its substances within in are ENERGY SPONGES • At anytime a sustance is either absorbing energy or releasing energy (just like a sponge with water) Temperature Larger Energy Sponge for Vaporization Small Sponge for Melting Heat Energy Added (calories or joules)
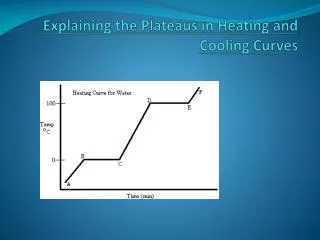
B. Heating Curves • Temperature Change • change in KE (molecular motion) • depends on heat capacity • Heat Capacity • energy required to raise the temp of 1 gram of a substance by 1°C • “Volcano” clip - water has a very high heat capacity
B. Heating Curves • Phase Change • change in PE (molecular arrangement) • BUT the temp remains constant until phase change is complete • Heat of Fusion (Hfus = 80 cal/g water) • energy required to melt 1 gram of a substance at its m.p. or energy released by 1 gram freezing at f.p.
B. Heating Curves • Heat of Vaporization (Hvap=540cal/g water) • energy required to boil 1 gram of a substance at its b.p. or energy released when 1 gram of vapor condensed into a liquid • usually larger than Hfus…why? • EX: sweating, steam burns, the drinking bird
C. Phase Diagrams • Show the phases of a substance at different temps and pressures.
Enthalpies of Vaporization (Heat of Vap) of common substances measured at their respective normal boiling points: Water is also commonly expressed as 539.423 calories per gram