Download
1 / 67
700 likes | 986 Views
Dose-adaptive study designs offer benefits for proof-of-concept / Phase IIa clinical trials, as well as raise issues for continued research. OUTLINE (Section 3): Dose-Adaptive Designs & Examples Definition & Introduction (Jim) Frequentist Designs, including Random Walk Designs (Jim)

E N D
Dose-adaptive study designs offer benefits for proof-of-concept / Phase IIa clinical trials,as well as raise issues for continued research OUTLINE (Section 3): Dose-Adaptive Designs & Examples • Definition & Introduction (Jim) • Frequentist Designs, including Random Walk Designs (Jim) • 3+3 Design for cancer • Up&Down Design • Biased Coin Designs • T-Statistic Design • Simulations of Up&Down Design for Dental Pain Clinical Trial • Bayesian-type Designs (Inna) • Continual Reassessment Method (CRM) • Bayesian D-optimal Design • Other related approaches • Bayesian 4-parameter logistic • Case Study (Inna) • CytelSim Software demo • Summary & Recommendations (Inna) • References Jim Bolognese & Inna Perevozskaya, Sept. 12, 2008
Acknowledgments • Anastasia Ivanova, UNC • Nitin Patel, Cytel, Inc. • Jeff Palmer, Cytel, Inc. • Vipul Suru, Cytel Inc. • Inna Perevozskaya, MRL • Yevgen Tymofyeyev, MRL • Keaven Anderson, MRL
Dose-Adaptive DesignDefinition • 1st patient’s (or group’s) dose chosen based on prior data • Each subsequent patient’s (or group’s) dose assigned based on pre-defined rules / algorithm • i.e., dose is adaptively assigned based on previous responses • Rules for dose assignment developed to target specific study objectives • Examples throughout this talk
Dose-Adaptive DesignKey Features • Prior response data used for sequential allocation of dose / treatment to subsequent (groups of) subjects • Random Walk designs: only last response • Spread observations in general region of interest • T-statistic Design: all prior responses from current study • Concentrates observations at target dose • Bayesian designs: all prior responses from current study • Current methods better for modeling dose-response curve & targeting particular level(s) of response (e.g., ED50, ED90, etc.) • Limit allocation to (extreme) doses of little interest • Maximize information gathered • Minimize sample size • Consistent with FDA Critical Path Initiative
Dose-Adaptive DesignKey Requirements • Response needs to be observable reasonably quickly • Requires more up-front statistical work (design simulation) • 1-2 months stat AND stat programming support prior to protocol review • Logistical issues • No allocation schedule: requires unblinded team to administrate • Requires ongoing communication with site regarding allocation • Requires rapid data transfer & analysis at each stage • Duration of patient enrollment needs to be (much?) longer than time to observed each patient’s response • Results are mainly estimation-based • Testing of hypotheses conditional on doses assigned
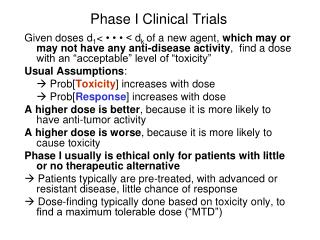
Early Phase Dose-Ranging DesignsBackground • Typically small, sequential studies aimed at determining the maximum tolerated dose (MTD) • Design considerations are particularly important in cancer studies (severe side effects of cytotoxic drugs) • Many references for dose-adaptive designs aimed at MTD or dose that yields specific degree of toxicity (e.g. TD30) • Current interest centers more on estimation of efficacy • Estimate dose for a specified degree of efficacy (e.g. ED50) • Up&Down Designs inform on targeted parts of dose-response curve • Bayesian-type Designs estimate target dose(s) from modeling dose-response curve • Balance between individual and collective ethics: • Maximum information from the minimal number of patients. • Maximize number of patients dosed in the range of interest
Single Dose-Adaptive Design can replace Typical PoC trial and Ph.IIa Dose-Ranging Trial Traditional Phase II Program . 2N* Patients ≥5N Patients ≥4N Patients Phase III PoC (Ib/IIa) (High Dose vs. Placebo) Dose- Finding Definitive Dose-Response (if needed) Phase II with Dose-Adaptive PoC Trial 3N^ Patients ≥4N Patients Phase III Definitive Dose-Response (if needed) PoC (High Dose vs. Placebo) ^ ~2N if futility realized Replace 2 trials with 1→≥4N fewer subjects; less time * N = # subjects / trmt group for desired precision in PoC trial
Single Dose-Adaptive Design can replace Typical PoC and Ph.IIa and Ph.IIb Trials !!! Traditional Phase II Program . 2N* Patients ≥5N Patients ≥4N Patients Phase III PoC (Ib/IIa) (High Dose vs. Placebo) Dose- Finding Definitive Dose-Response (if needed) Phase II with Dose-Adaptive PoC Trial 3N^ Patients Phase III: 1 trial at Target Dose & 1 Higher dose 1 trial at Target Dose & 1 Lower dose PoC (High Dose vs. Placebo) ^ ~2N if futility realized Replace 3 trials with 1→≥8N fewer subjects; MUCH less time * N = # subjects / trmt group for desired precision in PoC trial
Dose-adaptive study designs offer benefits for proof-of-concept / Phase IIa clinical trials,as well as raise issues for continued research OUTLINE (Section 3): Dose-Adaptive Designs & Examples • Definition & Introduction (Jim) • Frequentist Designs, including Random Walk Designs (Jim) • 3+3 Design for cancer • Up&Down Design • Biased Coin Designs • T-Statistic Design • Simulations of Up&Down Design for Dental Pain Clinical Trial • Bayesian-type Designs (Inna) • Continual Reassessment Method (CRM) • Bayesian D-optimal Design • Other related approaches • Bayesian 4-parameter logistic • Case Study (Inna) • CytelSim Software demo • Summary & Recommendations (Inna) • References Jim Bolognese & Inna Perevozskaya, Sept. 12, 2008
3+3 design for cancer (Geller, 1984)Definition • Designed under philosophy that MTD is identifiable from the data • Patients treated in groups of 3 • Designed to screen doses quickly; no estimation involved • Probability of stopping at incorrect dose level is higher than generally believed (Reiner, Paoletti, O’Quigley; 1999)
3+3 design for cancer Pros (+) & Cons (-) + substantially documented; extensive experience + estimates MTD at ~ 20% toxicity level + Weili He, et al., show how to re-estimate MTD at intended 30% level - derived estimates conditional on doses yielded by design - not well suited to yield efficacy info; yields little info above MTD (20-30% response level)
Up&Down DesignDefinition • Yields distribution of doses clustered around dose with 50% responders (ED50) • 1st subject / cohort receives dose chosen based on prior information • Subsequent subjects / cohorts receive next lower dose if previous subject / cohort responded, next higher dose if no response • Data Summaries: • proportion of responders at each dose • continuous data via summary statistics by dose • Inference based on conditional distribution of response given the doses yielded by the dosing scheme • 5 MRL examples from 1980’s (see back-up slides for 1 of them)
Biased Coin Design • Nonparametric generalization of the Up&Down Design • Up&Down Design (targets ED50): • After Response, Probability of next lower dose = 1 Probability of next higher dose = 0 • After non-Response, Probability of next lower dose = 0 Probability of next higher dose = 1 • Can alter these probabilities to target a specific level of response (EDxx) by “tossing the biased coin” • Yields cluster of observed doses around EDxx • Some patients will be assigned above and below EDxx • informs on dose-response Stylianou and Flournoy, 2002
Pros (+) & Cons (-) of Up&Down and Biased Coin Designs + easy to implement & understand + can be adapted so assigned doses migrate & cluster around EDxx + minimizes observations at doses too small or too large, in comparison to randomized design - less information on dose response away from EDxx + can compensate by simultaneously conducting 2 or 3 clusters; e.g., EDx1, EDx2, EDx3 - derived estimates conditional on doses yielded by design + yields information useful to design definitive studies
T-statistic Design - Definition 1 • Cumulative cohort design • Goal: find the dose with response level R. • Goal of dose assignment rule: assign as many subjects as possible to a dose with mean response R. • One dose assignment rule: • Step 1. Compute the T-Statistic comparing the mean response at the current dose to R: T = (mean-R)/SE • Step 2. • If T < -1, increase the dose • If T between -1 and 1, repeat the dose • If T higher than 1, decrease the dose
T-statistic Design - Definition 2 • Cumulative cohort design • Goal: find the dose with response level R. • Goal of dose assignment rule: assign as many subjects as possible to a dose with mean response R. • Another dose assignment rule: • Step 1. Compute the T-Statistic comparing the mean response at ALL doses observed so far, to R: Ti = (meani-R)/SE, i=1,2,…,D doses • Step 2. • Allocate next cohort to dose with Ti closest to 0
Clinical Trial ExampleDental Pain Model • Surgical removal of ≥2 3rd molars • As anesthesia wears off, pain increases • When pain reaches moderate or severe level (on ordinal discrete scale 0=none, 1=mild, 2=moderate, 3=severe), patients randomized to placebo, test drug, active control (e.g., 400 mg ibuprofen) • Pain Relief measured serially over 8 hours post treatment • 0=none, 1=some, 2=a little, 3=a lot, 4=complete • Primary endpoint is area under each patient’s pain relief curve over 0-8 hours • 0-hour pain relief assumed to be 0
Up & Down DesignSimulated from Past Trial Results • Single-dose, parallel group dental pain study (total 399 patients) • 51 placebo patients • 75 Dose 1 patients • 76 Dose 2 patients • 74 Dose 3 patients • 76 Dose 4 patients • 47 ibuprofen patients • Primary endpoint is Total Pain Relief (AUC) during 0-8 hours post dose (TOPAR8) • Dose-Adaptive Designs in sequential groups of 12 patients (3 placebo, 6 Test Drug Dose, 3 ibuprofen) • Up&Down-type [“Group”] Design • T-statistic Design (Definition 1)
Simulated Up&Down Designfrom completed Dental Pain Study • Sequential groups of 12 patients (3 placebo, 6 test drug, 3 ibuprofen) • First group receives Dose 2 • Subsequent group receives next higher dose if previous group is non-response, next lower dose if response • Response (both conditions satisfied): • Mean test drug – mean placebo ≥ 15 units TOPAR8 • Mean test drug – mean ibuprofen > 0 • Algorithm continues until all ibuprofen data exhausted • originally planned precision for ibuprofen vs placebo • (16 groups = 191 total patients)
Simulated T-Statistic Designfrom completed Dental Pain Study • Cumulative cohort design • Goal: find the dose with response level (mean test drug – mean placebo) ≥ 15 units TOPAR8 • Goal of dose assignment rule: assign as many subjects as possible to target dose. • Dose assignment rule: • Step 1. Compute the T-Statistic comparing the mean response at the current dose to R: T = (mean test drug – mean pbo - 15)/SE • Step 2. • If T < -1, increase one dose increment • If T between -1 and 1, repeat the dose • If T higher than 1, decrease one dose increment
Simulated Up&Down Resultsfrom Dental Pain Study data (1st 8 Groups in sequence)
Simulated Up&Down Resultsfrom Dental Pain Study data (last 8 Groups in sequence)
Example 1 – Dental Pain Trial Data re-sampled with Dose-Adaptive Designs
Example 1 – Dental Pain Trial Data re-sampled with Dose-Adaptive Designs
Remarks (1) • T-Statistic Design more efficient than Up&Down [“Group”] Design for allocating more patients to Target Dose • Up&Down [“Group”] Design spreads patient allocation across more doses than T-Statistic Design • Still clusters dose allocations around Target Dose • Choice of adaptive design depends on particular objectives of drug research program
Conclusions from Simulated Up&Down Design in Dental Pain • Up&Down & T-Statistic designs are viable for dose-ranging in Dental Pain • Yield similar dose-response information as parallel group design • Can use substantially fewer patients than parallel group design • T-Statistic Design yielded tighter concentration of patients near target dose than Up&Down • Logistics of implementation more complicated than usual parallel group design • Can be accomplished in single center or small number of centers
Example 2 - Dose-Adaptive Design Simulated from 12-week Obesity Trial Results • 12-week body weight loss (total 547 patients) • 547 pts (1:1:1:1:1) to placebo, Doses 1, 2, 3, 4 • Primary endpoint: mean weight change @ 12wks • Adaptive design applied to select sequential subsets of data • Sequential groups of patients formed by each 3 days of patient entry • Mon+Tues+Weds, Thurs+Fri+Sat (2 groups / week) • FPI to LPI 7.5 weeks yielded 15 sequential groups • Group size ranged from 8 to 70 • Dose selection for each sequential group based on 2-week body weight change results of a previous group (details next).
Example 2 - Dose-Adaptive Design Simulated from 12-week Obesity Trial Results • Sequential groups “randomized” (1:1:1) placebo and 2 doses • selected all patients in each group assigned to placebo and the 2 doses • Patients assigned to the 2 unselected doses ignored • Total sample size ~60% of total 531 patients • Doses for first 6 groups pre-selected according to balanced design • 7th group assigned 2 doses based on 2-week response of corresponding group 1 sequence, 8th based on response from group 2, etc. • Decrease one dose increment if prior group “responded” • Increase one dose increment if prior group “did not respond” • “Response” (Up&Down): ≥50% of Drug-treated patients with Week 2 BW loss ≥ 0.4 kg from placebo mean
Example 2 - Dose-Adaptive Design Simulated from 12-week Obesity Trial Results • Two T-statistic Design Sets of Response Rules • One for each active dose sequence group • Dose with minimum • T1=(active-placebo+0.4kg)/SE • T2=(active-placebo+0.8kg)/SE • Applied Definition 2 (Ti closest to 0)
Example 2 - Dose-Adaptive Design Simulated from 12-week Obesity Trial Results
Rationale for Adaptive Design in Obesity • Patients plentiful and enter rapidly, thus, use group sequential approach • To increase information about test drug yet provide info on placebo, use 1:1:1 allocation ratio (pbo:T1:T2) • Need sufficient number of sequence groups to allow design to span space of response (at least ~8-20) • Simulation studies demonstrate that adequate power achieved with ~50% larger total sample size than needed for MTD vs pbo “proof-of-concept” trial • Thus, eliminating ½ the active drug patients “about right” • Response definition (0.4 kg) chosen (based on prior data) • reasonable predictor of at least a 1 kg weight loss above placebo at Week 12 based on prior analysis of several 12-week weight loss studies.
Example 2 – Dose-Adaptive Design Simulated from Week 2 Mean Body Weight Change from Baseline
Example 2 – Dose-Adaptive Design Simulated from Obesity Trial - Week 2 Number of Patients Sampled
Example 2 – Dose-Adaptive Design Simulated from Week 12 Mean Body Weight Change from Baseline
Example 2 – Dose-Adaptive Design Simulated from Obesity Trial - Week 12 Number of Patients Sampled
Example 3 - Dose-Adaptive Design Simulated from 6-week Osteoarthritis Trial Results • 6-week osteoarthritis parallel group trial • 609 pts (1:2:2:2:2:2) to placebo and 5 doses • Primary endpoint: average mean Patient Global Assessment of Response to Therapy (PGART: 0-4 Likert scale) • Adaptive design applied to select subset of data in sequence • Sequential groups of patients formed by each week of patient entry • FPI to LPI 18 weeks yielded 18 sequential groups • Group size ranged from 10 to 74 • Dose selection for each sequential group based on 2-week PGART results of a previous group (lag similar to obesity trial).
Example 3 - Dose-Adaptive Design Simulated from 6-week Osteoarthritis Trial Results • Sequential groups “randomized” (1:1:1) placebo and 2 doses • selected all patients in each group assigned to placebo and the 2 doses • Patients assigned to the 3 unselected doses ignored • Total sample size <50% of total 609 patients • Doses for first 4 groups pre-selected according to balanced design • 5th group assigned 2 doses based on 2-week response of corresponding group 1 sequence, 6th based on response from group 2, etc. • Decrease one dose increment if prior group “responded” • Increase one dose increment if prior group “did not respond” • “Response” (Up&Down): ≥50% of active pts with Week 2 PGART “good” or “excellent”
Example 3 - Dose-Adaptive Design Simulated from 6-week Osteoarthritis Trial Results • Two T-statistic Design Sets of Response Rules • One for each active dose sequence group • Dose with minimum • T=(active-placebo+1)/SE • T=(active-placebo+2)/SE • Applied Definition 2 (Ti closest to 0)
Example 3 - Dose-Adaptive Design Simulated from OA Trial – Week 2 Mean PGART Results
Example 3 - Dose-Adaptive Design Simulated from OA Trial – Week 2 No. of Patients Sampled
Example 3 - Dose-Adaptive Design Simulated from OA Trial – Mean Time-Weighted Average PGART Wks 2-6
Example 3 - Dose-Adaptive Design Simulated from OA Trial – No. Patients Sampled Weeks 2-6
Remarks (2) • Logistics of implementation more complicated than usual parallel group design • Frequent data calls / brief simple analyses • Close contact with sites re: dose assignments • Special packaging (IVRS??) • Drug Supply – needed sufficiently for many possibilities • Tolerability rule(s) can be added for downward dose-assignment if pre-specified AE criteria are encountered • This has been studied in context of Bayesian dose-adaptive designs, but not in context of up&down designs • Number of placebo patients maintained as designed for intended precision vs. that group; could be down-sized, though
Simulations of Up&Down Design in Dental Pain Model • Sequential groups of 8-16 patients enter each study day • Each group randomized to placebo, dose X of study drug, ibuprofen (varying from ~ 1:2:1 to ~ 1:3:1) • (2:4:2), (2:5:2), (2:6:2), (3:6:2), (3:7:2), (3:8:2), (3:9:2), (3:9:3), (3:10:3) • Initial group receives dose 3 from doses 1-7 • Subsequent groups receive dose based on % of active dose responses in previous group • Up 2 dose increments if <20% responders • Up 1 dose increment if 20-39% responders • Repeat same dose if 40-60% responders • Down 1 dose increment if 61-80% responders • Down 2 dose increments if >80% responders • Response = TOPAR8 > 15 units more than group placebo mean • Study stops when total sample size exceeds 140
Simulations of Up&Down Design in Dental Pain Model • 7 true underlying dose-response curves (SD=9) Assumed true underlying mean TOPAR8 Distribution pbo dose1 dose2 dose3 dose4 dose5 dose6 dose7 0:no effect 5 5 5 5 5 5 5 5 1l:weak 5 6 8 10 10 10 10 10 1r: 5 5 5 5 5 6 7 10 2l:modest 5 7 9 13 13 13 13 13 2r: 5 5 5 5 7 9 11 13 3l:ibuprofen 5 8 12 16 19 19 19 19 3r: 5 5 5 5 8 12 15 19 • 5000 simulations of up&down design for each distribution • Computed mean TOPAR8 at each dose for each simulation of the up&down design (total sample size ≥ 140 patients)
Distributions of Simulation Results (observed TOPAR8 means by dose) for Left-Shifted True Distributions 75th percentile median 25th percentile True values = connected circles
Distributions of Simulation Results for Right-Shifted True Distributions
Distributions of Simulation Results for No-effect True Distribution Each pair left = simulation results Each pair right = true distribution 95th percentile 75th percentile median 25th percentile 5th percentile 33 <1 <1 7 1 7 2 70 average sample sizes
Distributions of Simulation Results fromTrue Distributions 0, 1l, 2l, 3l