Download
1 / 43
430 likes | 580 Views
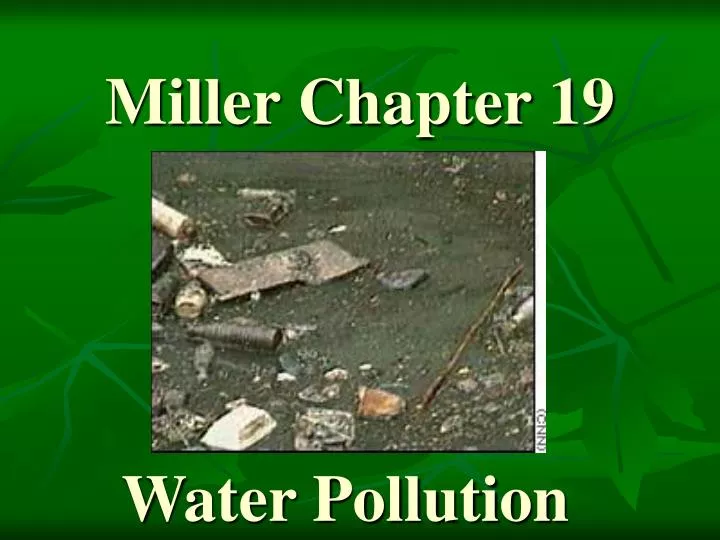
Miller Chapter 19. Water Pollution. Water Pollution Defined. Any chemical , biological, or physical change in water quality that has a harmful effect on living organisms or makes water unsuitable for desired uses. One of every five people in the world lacks access to safe drinking water.

E N D
Miller Chapter 19 Water Pollution
Water Pollution Defined • Any chemical , biological, or physical change in water quality that has a harmful effect on living organisms or makes water unsuitable for desired uses.
One of every five people in the world lacks access to safe drinking water. • Ninety-five percent of people in developed countries and 74% of people in developing countries have access to clean drinking water. • In a warmer world, too much rain and too little rain can increase water pollution.
Types and Sources of Water Pollution • Infectious Agents • Oxygen-Demanding • Inorganic Chemicals • Organic Chemicals • Plant Nutrients • Sediment • Radioactive • Thermal Table 19.1
I. Methods of Determining Water Quality A. Coliform Bacteria • 0 colonies per 100ml for drinking water • 200 colonies per 100ml for swimming
B. Biological Oxygen Demand (BOD) • The amount of oxygen needed by decomposers to break down organic material over a 5-day period at 680F
Water Quality Do (ppm) at 20˚C Good 8-9 Slightly polluted 6.7-8 Moderately polluted 4.5-6.7 Heavily polluted Below 4.5 Gravely polluted Below 4 Dissolved Oxygen (DO) • Only a few species of fish can survive when the D.O. level drops below 4 ppm at 20˚C
C. Chemical Analysis • Determine the levels of organic and inorganic pollution
D. Indicator Species • Indicator species can be used to monitor water quality • Ex: Mussels, Cattails, Insect larva • Analyzed to measure the levels of various chemicals
II. Sources of Pollution A. Point Sources -Discharge from a specific location (pipe, ditch or sewer) -Easier to identify and regulate Ex: Factories, Sewage Treatment Plants, Mines, Thermal Outlets and Oil Tankers.
B. Non-Point Sources -Cannot be traced to a specific discharge -Difficult to identify and control Ex: Golf Courses, Agriculture, Homes
NONPOINT SOURCES Rural homes Cropland Urban streets Animal feedlot POINT SOURCES Suburban development Factory Wastewater treatment plant Point and Nonpoint Sources
Sources of water pollution The leading sources of water pollution are agriculture, industries, and mining. 1. Agricultural activities are the leading cause of water pollution from erosion, overgrazing, fertilizers and pesticides, and excess salt from irrigated soils. 2. Industrial facilities are another large source of water pollution, and mining is a third source.
III.Water Pollution A. Freshwater Rivers and Streams: -Most pollution in the form of: • chemicals from industry or mines, • malfunctioning sewage plants, • Non-point runoff • Naturally, streams and rivers can rebound: • As long they are not overloaded with pollutants & flow is not reduced
OXYGEN SAG CURVE The breakdown of degradable wastes by bacteria depletes dissolved oxygen -Reduces the population of oxygen requiring organisms. -Shown as an
Clean Zone Decomposition Zone Septic Zone Recovery Zone Clean Zone (Trout, perch, bass, mayfly, stonefly) (carp, gar, Leeches) Fish absent, fungi, Sludge worms, bacteria (anaerobic) Normal clean water organisms Types of organisms 8 ppm 8 ppm Dissolved oxygen Oxygen sag Concentration Biological oxygen demand 2 ppm Direction of flow Point of waste or heat discharge Time of distance downstream Trash fish
-Recovery from oxygen depletion is based on the volume of the pollutant and … • Stream Volume • Flow Rate • Temperature • pH level • A combination of dilution and biodegradation can allow recovery of stream pollution
Water Pollution: Now Most developed countries have reduced point source pollution, but toxic chemicals and pollution from non-point sources are still problems. Stream pollution in most developing countries is a serious and growing problem. Half of the world’s 500 major rivers are heavily polluted, and most of them run through developing countries where waste treatment is minimal or nonexistent. For example: Religious beliefs, cultural traditions, poverty, little economic development, and a large population interact to cause severe pollution of the Ganges River in India.
B. Lakes -More vulnerable than streams due to… • Stratified layers, • Little flow, • Low water volumes. • Vulnerable to Biological Magnification & • Cultural Eutrophication: • Human activities that increase the level of plant nutrients in lakes: phosphate, nitrate effluents
Pollution of Lakes • Slow turnover • Flushing and changing of water • Thermal stratification • Little vertical mixing • Biological Magnification • Increase in the concentration of chemicals in organisms at successively higher trophic levels of a food chain • Eutrophication • Natural nutrient enrichment of lakes
Water 0.000002 ppm Herring gull 124 ppm Phytoplankton 0.0025 ppm Herring gull eggs 124 ppm Lake trout 4.83 ppm Zooplankton 0.123ppm Rainbow smelt 1.04 ppm Biomagnification
Cultural Eutrophication • In hot weather nutrients overload streams with dense growth of algae ,cyanobacteria,water hyacinths • As algae die, decomposition by aerobic bacteria depletes DO in surface layer of shore and bottom of lakes • If excess nutrients flow in anaerobic bacteria take over and produce gaseous decomposition problems (flammable methane) • Solutions? Ban phosphates, remove veg.
Cultural Eutrophication Discharge of untreated municipal sewage (nitrates and phosphates) Nitrogen compounds produced by cars and factories Natural runoff (nitrates and phosphates Discharge of detergents ( phosphates) Manure runoff From feedlots (nitrates and Phosphates, ammonia) Discharge of treated municipal sewage (primary and secondary treatment: nitrates and phosphates) Runoff from streets, lawns, and construction lots (nitrates and phosphates) Lake ecosystem nutrient overload and breakdown of chemical cycling Runoff and erosion (from from cultivation, mining, construction, and poor land use) Dissolving of nitrogen oxides (from internal combustion engines and furnaces)
Case Study: GREAT LAKES POLLUTION • GL contain 95% of freshwater in U.S. • Hold 20% of all freshwater in world • 1960: huge cultural eutrophication problems -Lake Erie the worst: shallowest 1972 : 20 billion put into cleanup Non point worst now than point ½ toxic compounds come from atmosphere PCB build up in food chain
Case Stud: The Great Lakes Fig. 22-8 p. 500
C. Groundwater - Easily contaminated by everyday activities - Flows slowly so it cannot dilute/disperse contaminants - Small population of decomposers - Cold temps. Slow Rx that remove wastes
Sources of GW Pollution • Storage lagoon • Septic systems • Landfills • Haz. Waste dumps • Deep well injecting wells Note: not so much an ecological threat as a drinking water problem
Contaminated Probability 10 to 20 percent Greater than 20 percent Not tested
Extent of Contamination: - Up to 25% of usable, U.S. groundwater - 60% of liquid waste injected into deep underground wells - Pumping of water at coastlines causes contamination of drinking water by saltwater intrusion.
Problems with GW Pollution • Can’t clean like surface water • No dilution • Moves slow • Small pop. of decomposing bacteria • Cold temp. slow down chem. Reaction Extent of problem: • 25% of US groundwater is contaminated 1. pesticide use prevalent in 38 states 2. 1/3 of waste ponds have no liners 3. leaking underground gas/oil storage tanks
Waste lagoon, pond, or basin Hazardous waste injection well Mining site Water pumping well Buried gasoline and solvent tanks Pumping well Road salt Sewer Landfill Cesspool, septic tank Leakage from faulty casing Unconfined freshwater aquifer Groundwater Confined freshwater aquifer Groundwater flow Discharge Confined aquifer
IV. Preventing/Reducing Water Pollution • Prevention: • -Wiser use of fertilizer and pesticides • -Plant buffer zones to control runoff • -Banning Deep Injection Wells • -Monitoring of waterways and aquifers • -Clean Water Act (1977) • -Water Quality Act (1987)
-Sewage Treatment 3 Levels of Purification A. Primary – mechanical treatment B. Secondary – biological treatment C. Advanced – Specialized chemical and physical processes to remove specific contaminants
Secondary Primary Grit chamber Chlorine disinfection tank Bar screen Settling tank Aeration tank Settling tank To river, lake, or ocean Raw sewage from sewers (kills bacteria) Sludge Activated sludge Air pump Sludge digester Sludge drying bed Disposed of in landfill or ocean or applied to cropland, pasture, or rangeland Fig. 19.15, p. 494
Specialized compound removal (DDT, etc.) Effluent from Secondary treatment Alum flocculation plus sediments Desalination (electrodialysis or reverse osmosis) Activated carbon Nitrate removal 98% of suspended solids 90% of phosphates To rivers, lakes, streams, oceans, reservoirs, or industries 98% of dissolved organics Most of dissolved salts Recycled to land for irrigation and fertilization
What about the Sludge? • Sewage sludge is a highly toxic mix of chemicals, infectious agents, and settle solids. -9% converted to compost -36% applied as fertilizer -55% dumped in landfills or burned
Ocean Pollution The ultimate sink; ability to dilute large amounts of waste Coastal areas bear most impact of ocean dumping Susceptible to harmful algae blooms(Red Tide)
Oil Spills Sources: offshore wells, tankers, pipelines and storage tanks, dredge spoil, sewage sludge Effects: death of organisms, loss of animal insulation and buoyancy, smothering Significant economic impacts Mechanical cleanup methods: skimmers and blotters Chemical cleanup methods: coagulants and dispersing agents
Technological Approach: Septic Systems Require suitable soils and maintenance
V. Drinking Water Quality • In U.S. we have safe drinking water standards set by the Safe Drinking Water Act of 1974 • Establishes Maximum Contamination Levels(MCL)for any pollutants. • Effects “city” water only, not wells. • Purification of water done in various ways
Solutions: Preventing and Reducing Surface Water Pollution Nonpoint Sources Point Sources Clean Water Act Reduce runoff Reduce fertilizer usage Water Quality Act -improved rec. quality by 50% -lessened soil erosion • Sewage plants increase • 100% Cap and trade policies Buffer zone vegetation Reduce soil erosion
Drinking Water Quality-access to clean drinking water is increasing worldwide Purification of urban drinking water Protection from terrorism Purification of rural drinking water Safe Drinking Water Act Maximum contaminant levels (MCLs) Bottled water
Preventing Water Pollution • - reduce poverty • Reduce groundwater contamination • Reduce non point source pollution • Reduce toxicity of volume of pollutants • Reuse wastewater • Recycle pollutants • Naturally treat sewage • Outcome???