Download
1 / 24
240 likes | 397 Views
Finger Pulse Display Module. Medical Instrumentation Spring 2011. Alex Bode Emmanuel Cordova Mikel Dualos Christa Hamilton . Overview. Clinical aspects Interface design Electronic module Video Presentation Design Issues and Observations Lessons Learned. Clinical Aspects.

E N D
Finger PulseDisplay Module Medical Instrumentation Spring 2011 Alex Bode Emmanuel Cordova Mikel Dualos Christa Hamilton
Overview • Clinical aspects • Interface design • Electronic module • Video Presentation • Design Issues and Observations • Lessons Learned
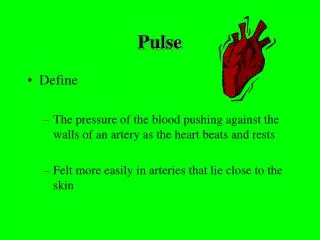
Clinical Aspects Morphology of Pulse Waveform The wave originates as left ventricle contracts. Aortic valve opens. Rapid rise in pressure as the aortic valve opens and the blood is pushed out of the left ventricle into the aorta. Fall in pressure in left ventricle until the aortic valve closes when aortic pressure exceeds that of the ventricle.
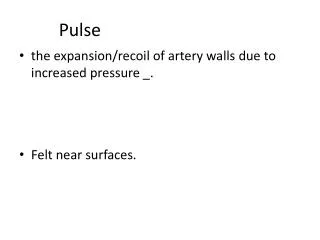
Clinical Aspects Morphology of Pulse Waveform The pressure causes the blood vessels to increase their radius. The radius increases 6-8%. Then bounce back to original size
Clinical Aspects Finger Tip Blood Flow Capillaries are the smallest blood vessels in the body. Form part of microcirculation. Thickness varies from 5-10 micro meters.
Clinical Aspects Finger Tip Blood Flow Red L.E.D projected through the finger tip. Production of 633-635 nm. Infrared L.E.D 850-950 nm (hemoglobin & H2O) Increase sensitivity by removing variability with change in O2 concentration.
Clinical Aspects Optical properties of Hemoglobin Hemoglobin makes up 97% of the blood dry weight. 35% wet weight however (H2O included). Low absorption in water (300-600 nm).
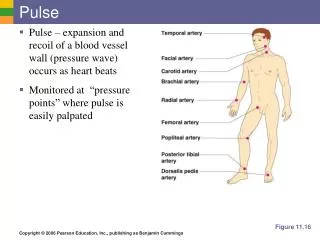
Clinical Aspects Optical Plethysmography Uses light absorbance to generate waveform from pulse. Oxymeters & microprocessor to process input Output (L.E.D & Display)
Mechanical Interface Design Phototransistor Semiconductor device used to capture light. Converts light energy into electrical energy. When light from a source object falls on the unit, it is amplified and passed to the base collector diode. Works best around 800 nm.
Mechanical Interface Design IR vs. Red LED Both signals required much time and manipulation to produce Red LED took less time depending on the individual Red LED chosen since it passed trough skin easier/ wavelength not as high as Infrared Infrared Red LED
Mechanical Interface Design Transducer Mount Two Possible configurations for the LED and Phototransistor: Configuration #1 : LED and Phototransistor 1cm apart with heads facing each other. Configuration #2: LED Phototransistor 1cm apart heads facing the ceiling . Configuration 1 Configuration 2
ElectronicModule Design Schematic *tape to keep offset potentiometer in place
Band-Pass Filters • Normal resting Heart rate is 70 bpm=1.17 Hz • Range of 20 bpm to 200 bpm • 0.33 Hz to 3.33 Hz • High pass filter=0.33 Hz • Low pass filter=3.33 Hz
Frequency Response Curve • Fc=1/(2*pi*R*C) • R=resistor value (ohms) • C=capacitance (Farads) • HP=0.33 Hz when C=10 uF R=47k ohms • LP=3.33 Hz when C=0.47 uF R=100k ohms
Band-Pass Filter • The capacitive and resistive input components make up the high-pass filter. • The capacitive and resistive feedback components make up the low-pass filter. • Rf/Rx+1=Gain
Operational Amplifier Gain • Output range for the LED bar graph display is .2 to 1.2 Volts. • Signal peak to peak is 20 mV. • (1.2-.2)/20m=50
Design Issues and Observations • Hand positing was very particular. Very time consuming to get a signal • Since it was difficult to get a signal, using the EKG waveform allowed us to continue working on the other segments of the circuit during development • Some noise was still visible in final output signal • Use of infrared LED may have reduced noise
No pressure should be applied onto skin from either transducer or LED, reduces capillary volume • 10 bar LED display type depends on pin 9 connection. Lessons Learned The collector voltage must be around 2.5 volts (half input voltage) in order for the photo transistor to properly transmit signal. (R1 = 10M)
Lessons Learned When choosing resistor and capacitor values, it is important to take into account the time constant RC. this affects how long it takes for 10 bar LED to move past the transient phase where all bars are lit and slowly decline.