Download
1 / 17
170 likes | 291 Views
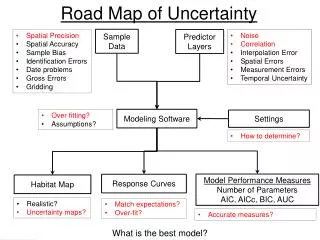
Sample Data. Non-commercial dredges December to March 1989-1990 Sampling changed somewhat 1255-1599 stratified random stations 3 regions >15mm carapace. Blue Crab Distribution Model. Predictors. Depth Salinity Water temp Distance from Bay Mouth

E N D
Sample Data • Non-commercial dredges • December to March • 1989-1990 • Sampling changed somewhat • 1255-1599 stratified random stations • 3 regions • >15mm carapace
Predictors • Depth • Salinity • Water temp • Distance from Bay Mouth • Distance to submerged aquatic vegetation • Slope • Bottom type not available
Predictors • Bottom temp and salinity • 99 to 123 sites per year • Kriging • Distance to Bay mouth • Lowest-cost path from 250m raster map • Slope • 30 meter bathymetry
Modeling • 75% training, 25% test • Stage I • Logistic: binomial error distribution, logit link • D=depth, M=distance to mouth, V=distance to veg, S=salinity, B=bottom slope, T=temp • Stage II: female density sites >=1 crab • Abundance:
Distance From Mouth
Blue Crab vs. Salinity Jensen et. al. 2005, Winter distribution of blue crab Callinectessapidus in Chesapeake Bay: application and cross-validation of a two-stage generalized additive model