Download

1 / 21
210 likes | 396 Views
Wind Data for Transmission/Integration Studies. Debra Lew WECC TEPPC DWG Sep 20, 2011. The problem. What do utility planners need? How to integrate anticipated increases of wind power into their system – various levels of planning studies

E N D
Wind Data for Transmission/Integration Studies Debra Lew WECC TEPPC DWG Sep 20, 2011
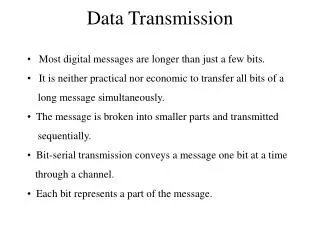
The problem • What do utility planners need? • How to integrate anticipated increases of wind power into their system – various levels of planning studies • Time-series wind power output from hypothetical plants for a historical year(s) • 1 hour, 10 min, 1 min, 1 sec • Time-series wind power forecasts for hypothetical plants • Day-ahead, 4-6 hours ahead, hour ahead • What do they have? • Wind plant data from a limited number of plants • Wind speed data from a limited number of met towers • One solution • Synthesis of wind data based on measurements, numerical weather prediction modeling
Synthesizing wind plant output • Physics-based models – Numerical Weather Prediction (NWP) models • NWP models use Reanalysis data for boundary conditions • Downscale to finer resolution using physical equations • Provides regional temporal and spatial correlation • Tend to show less variability than measurements • Significant computational requirements • Statistical models – Model Output Statistics (MOS) corrections • Correct systematic biases • Account for local processes • Incorporate additional observations • Power conversion models • Add stochasticity
The metrics • Realistic characteristics of wind: • Diurnal, seasonal variability • Ramping/variability characteristics on different timescales • Spatial correlation • Geographic diversity • Temporal correlation • Capacity factor We cannot match historical data exactly. We are trying to get overall statistics right.
Appropriate uses of this database: Spatial and temporal comparisons of sites • Geographic diversity • Load correlation Estimates of power production from hypothetical wind plants • Investigating needs for storage based on wind variability • Examining potential transmission line loadings from hypothetical wind farms • Simple economic calculations comparing cost of delivered energy from in-state versus out-of-state
Inappropriate uses of this database Needs for high accuracy, absolute wind speed or power output Long-term average wind speed or wind power output This was not designed to be used as the only basis for investment. Ground-truthing modeled data with actual measurements is critical.
Numerical Weather Prediction Model 3TIER generated historical wind data by running a Numerical Weather Prediction Model using physical conservation equations that ‘recreate the weather’ for 2004-6.
How the wind resource is modeled • 3TIER sampled the weather at a 2 km spatial and 10 minute temporal resolution, and at 5 hub heights (10, 20, 50, 100, 200m). • Based on a limited number of actual tower measurements for that time period, they did a sophisticated adjustment of model results. • Validation reports comparing wind speeds to measured data at 30 sites show good correlation. • 3TIER assumed each grid point can hold 10 turbines or a 30 MW wind plant. They converted wind speed to wind plant power output, assuming Vestas V90 3 MW turbines at 100m hub height, using a stochastic process to replicate actual wind plant output. • 3TIER produced hourly forecasts for day-ahead wind power output for the 32,043 selected sites.
Power conversion process • Mesoscale models tend to be excessively smooth • Real power curves are not deterministic • 3TIER’s SCORE process adds in the ‘noise’ found in real wind plant output • SCORE process designed to give statistically correct behavior but not necessarily match power output at any specific time • Assumed Vestas V90 3 MW turbines
Wind speed validation • Validation reports comparing wind speeds to measured data at 30 sites show good correlation. • Model performs better in ‘non-complex’ terrain • West of Rocky Mountains, the model tends to overestimate downslope acceleration and underestimate thermally driven winds • East of Rocky Mountains, model performs better
Fixing the 3-day seam (Sep 2011) Source: Jack King
WECC wind plant output validation Mesoscale wind data capacity factor off by 2-9%
Texas wind plant output validation 536 MW in 5 wind plants
1 minute data synthesis Used 1 minute samples from measured wind plant output in ERCOT and applied residuals to 10 minute data retaining 10 min trends
Conclusions/Recommendations • Data checks • Check your data in as many ways as possible as you can before initiating your power system modeling. Especially with large datasets for big geographic regions, a lot of things can go wrong. Knowing exactly how the data was synthesized can point you to which checks to make. • TEPPC uses • Select sites using WREZ or long term wind maps to reflect long term site averages as opposed to 3 year site averages. • Focus on energy penetration levels instead of capacity because capacity factors in 3TIER data may be less accurate than that indicated in long term wind maps. Resulting impact will be a slight geographic diversity impact.
Website to download wind/solar data • http://mercator.nrel.gov/wwsi/
Website for wind data in WECC • http://www.nrel.gov/wind/integrationdatasets/western/data.html
Reports – Western Wind Dataset http://www.nrel.gov/docs/fy10osti/47676.pdf http://wind.nrel.gov/public/WWIS/01-Potter.pdf http://multi-science.metapress.com/content/b302151784413261/fulltext.pdf 34 Validation reports at http://wind.nrel.gov/public/WWIS/3TIERValidation/
Contact info • Debra Lew • 303-384-7037 • Debra.lew@nrel.gov