Download
1 / 39
390 likes | 588 Views
Market Penetration of Biodiesel. Kenneth R. Szulczyk, Ph.D. Why Biodiesel?. U.S. petroleum reserves are declining U.S. petroleum imports are increasing Biodiesel substitutes for diesel fuel Biodiesel could slow down petroleum consumption. Why Biodiesel?. U.S. Petroleum Production

E N D
Market Penetration of Biodiesel Kenneth R. Szulczyk, Ph.D.
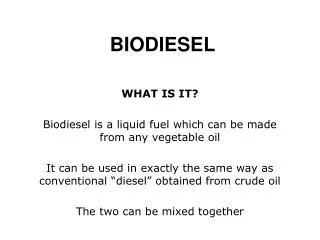
Why Biodiesel? • U.S. petroleum reserves are declining • U.S. petroleum imports are increasing • Biodiesel substitutes for diesel fuel • Biodiesel could slow down petroleum consumption
Why Biodiesel? • U.S. Petroleum Production • 1,000s of barrels • Peaked in 1970s
Why Biodiesel? • U.S. Petroleum Imports • 1,000s of barrels • 1960 to 2005 • OPEC • Non-OPEC sources
Why Biodiesel? • Combustion of fossil fuels is a large source of carbon dioxide emissions • Global Warming • Greenhouse Effect • Belief that greenhouse gases like carbon dioxide are accumulating in atmosphere, causing the earth to become warmer
Why Biodiesel? • Biodiesel recycles carbon dioxide from atmosphere • Biodiesel has cleaner emissions than diesel fuel • Lowers tail-pipe emissions • Hydrocarbon (HC) • Carbon monoxide (CO) • Particulate matter (PM)
Biodiesel Problems • Biodiesel increases NOX emissions • Nitrous oxide • Biodiesel contains 93.4% energy by volume • Biodiesel made from • Saturated oil freezes around 100 C • Unsaturated oil freezes around -40 C • Presents a problem for winter use
Paper’s Purpose • Could biodiesel feasibly replace fossil fuel? • Predict market penetration of biodiesel into the U.S. diesel fuel market
Paper’s Purpose • Needed to do the following: • Calculate chemical conversion of vegetable oils into biodiesel • Determine impact of technological improvement • Calculate economic costs from literature • Account for market interactions • Biodiesel competes with other markets for feedstocks
Agricultural Markets • Biodiesel sources for United States • 1995 – 2000 Average • Soybean oil • 3.336 billion kilograms • Largest oil source • Corn oil • 1.2 billion kilograms • Second largest oil source
Agricultural Markets • Biodiesel sources for United States • 1995 – 2000 Average • Animal fats • Edible tallow • 739 million kilograms • Inedible tallow • 1.754 billion kilograms • Yellow grease • Used cooking oil from restaurants • 1.197 billion kilograms • Cheap source of oil
Agricultural Markets • Biodiesel diverts feedstocks away from • U.S. animal feed markets • Cattle, hogs, horses, mules, poultry, and sheep • U.S. export markets • U.S. human food • Production budgets are described in detail • Agricultural model
Soybean Markets • Soybeans • Animal feed markets • Export markets • Crushing facilities • Crushing facility • Soybean oil • Food and biodiesel industries • Export markets • Soybean meal • Animal feed industries • Export markets
Corn Markets • Corn • Export markets • Animal feed markets • Ethanol industry • Substitute for gasoline • Corn wet mill • Produces a variety of products
Corn Markets • Corn wet mill • Corn oil • Food and biodiesel industries • Gluten feed and gluten meal • Animal feed markets • Corn Starch • Corn starch can be produced into many products
Corn Markets • Corn Wet Mill • Corn Starch can be made into: • Ethanol • High fructose corn syrup • Artificial sugar used in food • Baked goods, Beverages, Canned goods, and Confections • Dextrose • Corn syrup
Tallow Markets • Tallow • Byproduct of cattle industry • Domestic and biodiesel markets • No international markets • 100 kilograms of meat (beef) yields 16.35 kilograms of tallow
Yellow Grease Markets • Yellow grease • Waste cooking oil from restaurants • Domestic and biodiesel markets • No international markets • Assumed each pound of soybean or corn oil returns 0.1268 pounds of yellow grease
FASOM-GHG • Forest and Agricultural Sector Optimization Model-Greenhouse Gas (FASOM-GHG) • Large quadratic programming model • Written in General Algebraic Modeling System (GAMS) • Account for market interactions • Predict biodiesel market penetration
FASOM-GHG • United States decomposed into • 63 agricultural production regions • 11 regions for primary and secondary products • Contains import and export markets for many products
FASOM-GHG • 56 primary products markets • Agricultural and animal industries • 39 secondary products markets • Producers process primary products into finished products
FASOM-GHG • Biodiesel has two cost types 1. Endogenous Costs - determined in FASOM-GHG • Feedstock costs – producers purchase feedstocks to convert to biodiesel • Hauling costs – harvesting and hauling feedstocks to processing facilities • Update for crop yield improvements • Different regions have different crop yields
FASOM-GHG 2. Exogenous Costs - fixed and do not change • Production costs – cost to chemically convert oil into biodiesel • Yellow grease is $1.159 per gallon • Other sources are $0.76 per gallon • Capital costs – cost of buildings, equipment, chemical tanks, et cetera. • 10 year life for capital; 8% interest rate • All sources are $0.0628 per gallon • Transportation costs – cost of transporting biodiesel to retail markets (includes storage) • All sources are $0.05 per gallon
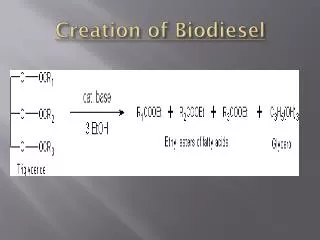
FASOM-GHG • Chemical yields • One gallon of oil (or tallow) yields 1 gallon of biodiesel • Conversion efficiency is 98% of theoretical • Derived from chemical reaction • No technological improvement for biodiesel • Chemical conversion is quite efficient
FASOM-GHG • Biodiesel produces glycerol as a byproduct • Chemical companies use glycerol to make soap, dynamite, foods, cosmetics, and pharmaceutical products • Glycerol is not included in FASOM-GHG • A large biodiesel industry would saturate the glycerol market • Glycerol price would drop significantly
Predicted Market Penetration • Diesel fuel price is proportional to gasoline fuel price Pdiesel = 0.8643 Pgasoline • Gasoline price ranges $1 to $3 per gallon • No international markets for biodiesel
Predicted Market Penetration • U.S. federal subsidies • Yellow grease is $0.50 per gallon • Other sources are $1.00 per gallon • Time period • Ranges from 2000 to 2020 • 2020 is not shown, because it contains terminal conditions
Predicted Market Penetration • Time paths have a “dip” • Source is from soybean and cattle markets. • Between 2005 and 2015 • Producers crush and export fewer soybeans • Soybean and cattle production are increasing over time. • An expanding cattle industry requires more feeds, e.g. soybeans • Soybeans are diverted from biodiesel industry
Predicted Market Penetration • Setting Gasoline price to $3 per gallon • View sources of biodiesel
Note • FASOM-GHG • Contains ethanol production • Substitutes for gasoline • Contains 3 technologies • Dry grind • Corn wet mill • Lignocellulostic – crop residues • Contains biomass production • Burns crop and wood residues for electricity • Co-fire with coal in different percentages
Conclusion • In 2004 • U.S. produced 58.6 billion gallons of diesel fuel • U.S. refineries operate at 93% of capacity • Biodiesel obtains a 3.1% market share in 2015 with gasoline price of $3 per gallon
Conclusion • Biodiesel is not likely to reduce reliance on petroleum • For more information, refer to: • Szulczyk, Kenneth Ray. May 2007. Market Penetration of Biodiesel and Ethanol. College Station, TX: Dissertation submitted to Texas A&M University.