Download
1 / 22
220 likes | 355 Views
Application of T382 CFS Forecasts for Dynamic Hurricane Season Prediction. J. Schemm, L. Long, S. Saha and S. Moorthi NOAA/NWS/NCEP October 21, 2008 The 33rd Climate Diagnostics and Prediction Workshop, Lincoln, NE. Outline. Description of the CFS experiment Datasets Used

E N D
Application of T382 CFS Forecasts for Dynamic Hurricane Season Prediction J. Schemm, L. Long, S. Saha and S. Moorthi NOAA/NWS/NCEP October 21, 2008 The 33rd Climate Diagnostics and Prediction Workshop, Lincoln, NE
Outline • Description of the CFS experiment • Datasets Used • IRI Detection and Tracking Method • Analysis of storm activity statistics • Focus on the Atlantic Basin • Statistics • A look at CFS predictions for 2008 • Future plan
CFST382 hurricane season experiments • One of the FY07/08 CTB internal projects • AGCM - 2007 operational NCEP GFS in T382/L64 resolution LSM - Noah LSM OGCM - GFDL MOM3 3. All runs initialized with NCEP/DOE R2 and NCEP GODAS. Initial conditions at 0Z, Apr. 19, 20, (21) and May 15(FY07) for 1981-2007. Forecasts extended to December 1. 4. For May 15 cases, runs in T62 and T126 resolutions also performed.
Datasets • CFS hindcasts at T382 • May 15th Initial Condition • Output at every 3 hours • 1981-2007, 27 years • April 19th and April 20th Initial Condition • Output at every 6 hours • 1981-2008, 28 years • More appropriate ICs for CPC Operational Hurricane Season Outlook • Observations from the HURDAT and JTWC Best Track Dataset • -Tropical depressions and subtropical storms • are not included in storm counts.
Tropical Cyclone Detection Method • Based on method devised by Camargo and Zebiak (2002) at IRI • Detection algorithm uses basin-dependent threshold criteria for three variables • Vorticity, xthresh xthresh = 2sx • 10-m Wind Speed, uthresh uthresh = ugl + suugl= wind speed averaged over all global basins • Vertically integrated temp anomaly, Tthresh • Tthresh = sT/2 • Calculated using only warm-core systems
Eight conditions must be met for a point to be considered a tropical cyclone 1. 850-hPa relative vorticity >xthresh 2. Maximum 10-m wind speed in a 7x7 box >uthresh 3. SLP is the minimum in the centered 7x7 box 4. Temp anomaly averaged over the 7x7 box and three pressure levels (300, 500, & 700 mb) > Tthresh 5. Temperature anomaly averaged over the 7x7 box is positive at all levels (300, 500, & 700 mb) * 6. Temperature anomaly averaged over the 7x7 box at 300mb > 850mb * 7. Wind speed averaged over the 7x7 box at 850mb > 300mb 8. The storm must last for at least 6 hours. * Criteria 5 & 6 define a warm core system.
Storm Tracking • Once a point is designated as a tropical cyclone, the cyclone is tracked forward and backward in time to create a full storm track. • The maximum vorticity in a 5x5 grid around the cyclone is found and a new 3x3 box is formed around it. • At the next time step, if the maximum vorticity in this new box is greater than 3.5 x 10⁻⁵ s-1, the procedure is repeated. • This point has become part of the storm track. • If two storm tracks are the same, they are considered the same cyclone and counted as one.
Atlantic Eastern North Pacific Western North Pacific North Indian Examples of Storm Tracks for 4 NH Basins
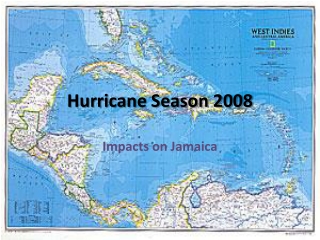
Atlantic Basin Atlantic Tropical Storms
Eastern Pacific Basin Eastern Pacific Tropical Storms
T382 R2 IC=0515 0.872 IC=0419 0.722 IC=0420 0.671 JJA Nino 3.4 SST Index
T382 R2 IC=0515 0.781 IC=0419 0.629 IC=0420 0.624 JJA Atlantic MDR SST Index
Tropical Storm Origins, 1981-2007 ASO OBS IC=0515 IC=0419 IC=0420
Total 81-93 94-06 El Nino La Nina Neutral IC=0419 0.44 -0.10 0.14 0.86 0.16 0.51 IC=0420 0.33 0.33 0.32 -0.39 0.30 IC=0515 0.35 0.18 0.40 0.55 0.85 0.08 Atlantic Basin Correlations Anomalies of Atlantic Storms N=27 N=13 N=13 N=8 N=5 N=14 0.79 Red= Statistically Significant at 0.95 Correlations based on 27-year anomaly
Correlations Total 81-93 94-06 El Nino La Nina Neutral IC=0419 0.47 0.05 0.23 0.74 0.65 0.35 IC=0420 0.58 0.70 0.15 0.22 0.49 IC=0515 0.66 0.61 0.69 0.52 0.80 0.37 0.90 Red = Statistically Significant at 0.95
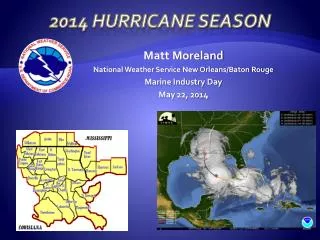
2008 Atlantic Season Summary As of October 17, 2008
Atlantic Basin Prediction for 2008 • Two additional runs were made using July 15th and 16th initial conditions for 2008 only • Used as a trial run for the CPC Hurricane Outlook Update
2008 May Jun Jul Aug Sep Oct Nov Total 0419 1 1 5 3 2 1 1 14 0421 1 3 3 2 4 2 15 0422 1 3 3 3 1 11 ENSM 1 1.33 3.67 2.33 3 1 0.67 13.33 0715 2 4 3 9 0716 1 4 8 2 1 16 Obs 1 3 4 4 15 Atlantic BasinCFS 2008 Monthly Storm Count 3
2008 Atlantic Storm Tracks (Courtesy of Unisys) Large number of storms over the Gulf of Mexico this year
.Summary • CFS in T382 resolution exhibits robust climatological seasonal cycle of tropical cyclone over four NH basins. • Warming trend and intensification of hurricane activity in the Atlantic basin captured in the CFS hindcasts. • Fair level of skill in predicting interannual variability of seasonal storm activities based on the limited number of forecast runs. • Continue to increase number of ensemble members for better climatology and storm statistics. Hope to provide input for 2009 Hurricane Season Outlook with real time prediction runs. • Prospect of multi-model ensemble approach for dynamical hurricane season prediction