Download

1 / 45
480 likes | 975 Views
Rational. Functions. Objectives. Identify rational functions Analyze graphs of rational functions’ Given a function, draw the graph Explain characteristics of the graph Given a variety of graphs, select the rational function graph and defend your choice. Introduction.

E N D
Rational Functions
Objectives • Identify rational functions • Analyze graphs of rational functions’ • Given a function, draw the graph • Explain characteristics of the graph • Given a variety of graphs, select the rational function graph and defend your choice
Introduction • The following are great websites to explore rational functions: http://id.mind.net/~zona/mmts/functionInstitute/rationalFunctions/rationalFunctions.html http://hh4.hollandhall.org/kluitwieler/Pages/RationalFunctions/Welcome.htm
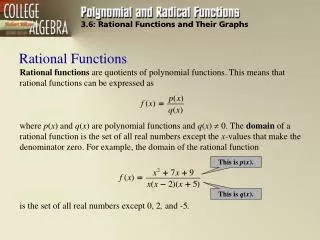
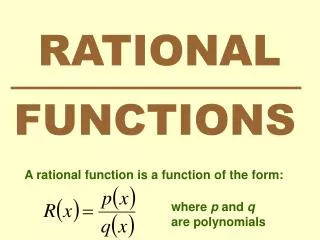
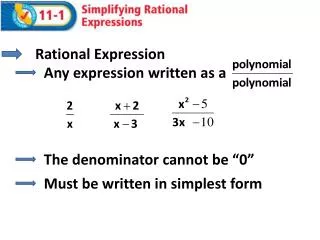
p(x) q(x) f(x) = I. Definition • A rational function can be written in the form: • p(x) and q(x) are polynomials where q(x)≠0
Which of the following functions are rational? No! Yes! Yes!
These rational functions make all kinds of “funny looking” graphs…
Graphs are discontinuous because they have breaks in the graph. • These breaks called “points of discontinuity” are either holes or vertical asymptotes. • What causes these points of discontinuity? • First we must look at the domain of the function.
II. Domain • The domain of a rational functions of x includes all real numbers except x-values that make the denominator zero. Think… What can you plug in for x? Or... What can you NOT plug in for x?
II. Domain • Example: • What value for x will make the denominator zero?
II. Domain • Example: • 0 will make the denominator zero. • Domain of f(x) is: {all real numbers except x=0.}
In order to find what makes the denominator zero, you will need to factor. Since -5 and 3 will make the denominator zero, these graphs will have points of discontinuity at x = -5 and x = 3.
Find the points of discontinuity: But how do you know if it is a hole or vertical asymptote?
It will produce a hole in the line if it cancels… • Example: Because 4 will make the denominator = 0, then there is a point of discontinuity at x = 4. However, since the (x-4)’s cancel, then it is a hole.
Since the (x-4)’s cancel out, we are really left with a line that looks like the line y = x + 3, but with a hole in it at x = 4. Notice how to enter it into calculator… Graph won’t appear to have a hole at x = 4. hole
III. Vertical Asymptote • Abbreviated V.A. • Occur on the graph of the function at the zeros of the denominator • Ex. 2 would make the denominator =0, and it does not cancel, so there is a VA at x =2.
III. Vertical Asymptote • Graph
State whether the points of discontinuity are holes or asymptotes. a.
IV. Horizontal Asymptote • Abbreviated H.A. • There are 3 different cases to determine horizontal asymptotes:
Horizontal Asymptotes • If the degree of p(x) is less than the degree of q(x), the graph has the x-axis (y=0) as a horizontal asymptote.
Horizontal Asymptotes • Case 1 Notice that the graph crosses the H.A. H.A.s only deal with END BEHAVIOR.
Horizontal Asymptotes 2. If the degree of p(x) equals degree of q(x), the graph has the line y=a/b, where a is the leading coefficient of p(x) and b is the leading coefficient of q(x).
Horizontal Asymptotes y=a/b=2/3 • Case 2
Horizontal Asymptotes 3. If the degree of p(x) is greater than the degree of q(x), the graph has no horizontal asymptote.
Horizontal Asymptotes No H.A. • Case 3
V. x-intercepts • Occur where p(x) equals zero (set the numerator = to zero) If p(x) is a constant (or imaginary), there is no x-intercept
VI. y-intercepts • Find by substituting zero in for x • Ex. (0,2) is the y-intercept
Type into calc: y = (x – 2)/(x(x+2))
Guidelines for Graphing Rational Functions • Find and plot the y-intercept • Find the zeros of p(x) and plot x-intercepts • Find zeros of q(x). Sketch vertical asymptotes • Find and sketch the horizontal asymptotes • Plot a few points around intercepts and asymptotes • Use smooth curves to complete the graph
3 0-2 - 3 2 = Example 1 • y-intercept (0,-3/2)
Example 1 • x-intercept – num. is 3, there are no x-int.
Example 1 • Vertical asymptotes – x-2=0 so x=2
Example 1 • Horizontal asymptotes is y=0
Example 1 • Additional Points
Example 1 • Smooth Curves
0 0-0-2 0 2 = = Example 2 0 • y-intercept (0,0)
Example 2 Numerator is zero when x=0 (0,0) • x-intercept
Example 2 x=-1 x=2 • Vertical asymptotes x2-x-2 = (x + 1)(x - 2)
Example 2 y=0 • Horizontal asymptotes
Example 2 • Additional Points -0.3 0.4 -0.5 0.75
Example 2 • Smooth Curves
x-intercepts - To make the numerator 0, x must be zero. (0, 0) is the x-intercept. y-intercepts - (0, 0) is also the y-intercept. vertical asymptotes ("bad" x-values)- Factor the bottom into (x - 3)(x +3). Setting this equal to zero we get two vertical asymptotes: x = 3 and x = -3. So far, our graph has a point at (0, 0) and two vertical dashed lines. horizontal asymptotes(end behavior) - The denominator has the highest degree term. Therefore, the denominator dominates (grows bigger faster than the top). Therefore, the y-values approach zero as x grows. Therefore y = 0 is the horizontal asymptote.
FOR MORE…GO TO… http://www.wiu.edu/users/mfjro1/wiu/tea/Functions/handouts/graphrat-howto.htm#near