Download
1 / 29
320 likes | 673 Views
Quality Function Deployment. QFD Benchmarking. Examples of Failed Product Innovations. Frequently occurring external causes [Eversheim 97] Insufficient market preparation (e.g. dishwasher of 90 cm height) Customer requirements not met (e.g. German eco-car)

E N D
Quality Function Deployment QFD Benchmarking QFD, Management of Technological Innovation, KV Patri
Examples of Failed Product Innovations Frequently occurring external causes [Eversheim 97] • Insufficient market preparation (e.g. dishwasher of 90 cm height) • Customer requirements not met (e.g. German eco-car) • Not technically perfected (e.g. first CVTs) • Too late on the market (e.g. video 2000) QFD, Management of Technological Innovation, KV Patri
Examples of Failed Product Innovations Frequently occurring internal causes [Eversheim 97]Plenty of ideas but too little acceptance • Lack of promoter • Communication disfunctional • Processing of subjects is unsystematic QFD, Management of Technological Innovation, KV Patri
A successful Innovation:Shower Head with Anti-lime System(Friedrich Grohe AG, Germany) [Eversheim 97] QFD, Management of Technological Innovation, KV Patri
Benchmarking The next six slides consist of notes from Tony Bendell, Louis Boutler, and Paul Goodstadt, Benchmarking for Competitive Advantage, Pitman Publishing, London, 1998 (HD62.15.B46) QFD, Management of Technological Innovation, KV Patri
1950s: The Japanese visited many thousands of American and European firms to absorb ideas regarding technology and business practices. Between 1952 and 1984, there were more than 42,000 contractual imports of knowledge. By 1960s, the Japanese were catching up. • In 1979, Xerox in the USA and Rank Xerox in Europe found themselves depressingly behind Fuji Xerox in Japan. They benchmarked their practices with those of Fuji Xerox and regained leadership. Today, Xerox is believed to be the major expert in benchmarking. QFD, Management of Technological Innovation, KV Patri
As the world becomes smaller, front-edge companies are realizing that they must match or exceed the best practices from competitors anywhere in the world in order to survive. • If we set our improvement targets without reference to those outside, our targets may not be taxing enough and we will fall behind. • During BM, it is not enough to compare output measures. We also need to understand ‘why’ through personal discovery. • Public sector benchmarking is a new and underutilized concept. QFD, Management of Technological Innovation, KV Patri
1. Understand markets and customers 2. Develop vision and strategy 3. Design products and services 4. Produce and deliver 5. Develop and manage human resources 6. Manage information 7. Market and sell 7. Market and sell 8. Invoice and service customers 9. Execute environmental management program 10. Manage financial and physical resources 11. Manage external relationships 12. Manage improvement and change Standard Process Classification System of the US-basedInternational Benchmarking Clearinghouse QFD, Management of Technological Innovation, KV Patri
1. Identify benchmarking subject 2. Identify comparative companies 3. Determine data collection method and collect data 4. Determine current competitive gap 5. Project future performance 6. Communicate findings and gain acceptance 7. Establish functional goals 8. Develop action plans 9. Implement and monitor progress 10. Recalibrate benchmark The Xerox Benchmarking Process QFD, Management of Technological Innovation, KV Patri
Critical Success Factors used by Xerox while Conducting BM • Customer satisfaction • Employee satisfaction • Return on assets • Market share QFD, Management of Technological Innovation, KV Patri
In the BM Exercises Conducted by Xerox Areas that have been benchmarked Bechmarking partners Manufacturing operations ---------- Manufacturing safety ---------------- Factory floor layout Research and product development Distribution --------------------------- Billing and Collection --------------- Quality Management ---------------- Quality improvement ---------------- Supplier development --------------- Saturn (a division of GM) Fuji-Xerox DuPont Cummins Engine Hewlett-Packard L.L. Bean Inc. American Express Toyota Florida Power and Light Honda Manufacturing of America QFD, Management of Technological Innovation, KV Patri
Quality Function DeploymentBuilding the House of Quality [Jackson 88] • Developed in Japan in the 1970s. First applied at the Kobe Shipyard of Mitsubishi Heavy Industries Ltd. • In the early 1980s, Dr. Don Clausing introduced QFD to Xerox. • The American Supplier Institute and GOAL/QPC led the movement in the US. QFD, Management of Technological Innovation, KV Patri
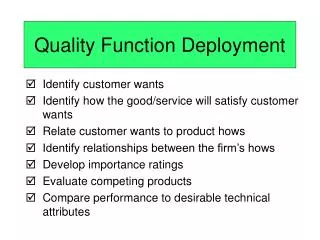
QFD is a structured method that • uses the 7 M&P tools to identify and prioritize customer requirements, • translates customer requirements into engineering requirements • systematically deploys the engineering requirements throughout the company at each stage of product development and improvement. QFD, Management of Technological Innovation, KV Patri
Establishing Customer Requirements: Needs, Wants and Exciters • Yesterday’s exciters are today’s wants. Today’s wants are tomorrow’s needs. • Stratify customers into groups using a tree diagram, affinity diagram, Pareto diagram, or other method. • Establish requirements each customer group through customer surveys, market research, analysis of service data, reviewing contractual requirements, or reviewing regulatory requirements. QFD, Management of Technological Innovation, KV Patri
The 7 Manufacturing & Planning tools are • Affinity Diagram • Interrelationship Graph • Tree Diagram • Matrix Diagram • Process Diagram Program Chart • Arrow Diagram • Matrix Data Analysis QFD, Management of Technological Innovation, KV Patri
What-How Matrix Relationship [Jackson 96] HOW WHAT QFD, Management of Technological Innovation, KV Patri
Level 1 Matrix Deployment [Jackson 96] Objective (How) Sell Product Goal (What) Make Profit QFD, Management of Technological Innovation, KV Patri
Level 2 Matrix Deployment (and so on) [Jackson 96] Objective (How) Manufacture Products Receive Orders Ship Goods Goal (What) Advertise Sell Product QFD, Management of Technological Innovation, KV Patri
Design Requirements Engineering Design Product Characteristics Customer Requirements Design Requirements Engineering design Deployment of Customer Requirements to Product Characteristics [Jackson 96] QFD, Management of Technological Innovation, KV Patri
Product Characteristics Manufacturing/ Purchasing Operations Production/ Quality Controls Engineering Design Product Characteristics Manufacturing/ Purchasing Operations Deployment of Product Characteristics to Production/Quality Controls [Jackson 96] QFD, Management of Technological Innovation, KV Patri
Building the House of Quality 1. Establishing Customer Requirements 2. Determining Design Requirements 3. Developing the Relationship Matrix 4. Developing the Interaction Matrix 5. Establishing Priorities for the Design Requirements 6. Completing the House of Quality QFD, Management of Technological Innovation, KV Patri
Step 1 Establishing Customer Requirements [Jackson 96] Strong Design Requirements Medium Consumer Priority Weak Customer Requirements Cr-1 High Degree of Compatibility CR-2 Ease of Operation CR-3 Capable of Close Tolerance Cr-4 Minimal Operating Time Cr-5 Highly Reliable QFD, Management of Technological Innovation, KV Patri
Step 2: Determining Design Requirements [Jackson 96] Strong Design Requirements Medium Consumer Priority Module-level Replacement Mean Time Between Failures = 5000 hrs Self-Calibration Accuracy = 0.0001 in Computer Controlled Mean Time to Repair = 0.5 hrs Weak Built-in Self-Test Customer Requirements Cr-1 High Degree of Compatibility CR-2 Ease of Operation CR-3 Capable of Close Tolerance Cr-4 Minimal Operating Time Cr-5 Highly Reliable QFD, Management of Technological Innovation, KV Patri
Step 3: Developing the Relationship Matrix [Jackson 96] Strong Design Requirements Medium Consumer Priority Module-level Replacement Mean Time Between Failures = 5000 hrs Self-Calibration Accuracy = 0.0001 in Computer Controlled Mean Time to Repair = 0.5 hrs Weak Built-in Self-Test Customer Requirements Cr-1 High Degree of Compatibility CR-2 Ease of Operation CR-3 Capable of Close Tolerance Cr-4 Minimal Operating Time Cr-5 Highly Reliable QFD, Management of Technological Innovation, KV Patri
Step4 Developing the Interaction Matrix [Jackson 96] Strong Medium Consumer Priority Module-level Replacement Mean Time Between Failures = 5000 hrs Self-Calibration Accuracy = 0.0001 in Computer Controlled Mean Time to Repair = 0.5 hrs Weak Built-in Self-Test Customer Requirements Cr-1 High Degree of Compatibility CR-2 Ease of Operation CR-3 Capable of Close Tolerance Cr-4 Minimal Operating Time Cr-5 Highly Reliable QFD, Management of Technological Innovation, KV Patri
Benchmarking Score based on the degree to which customer requirements are met Strong = 9 Medium =3 Consumer Priority Module-level Replacement Mean Time Between Failures = 5000 hrs Self-Calibration Accuracy = 0.0001 in Computer Controlled Mean Time to Repair = 0.5 hrs Weak = 1 Built-in Self-Test 1 2 3 4 5 Customer Requirements Cr-1 High Degree of Compatibility A B C O 1 O C B A CR-2 Ease of Operation B C O A CR-3 Capable of Close Tolerance A B C O Cr-4 Minimal Operating Time A B O C Cr-5 Highly Reliable Risk Absolute 12 9 15 14 2 8 3 Weights 27 15 14 6 24 3 Relative 108 Key Elements X X X Technical Benchmarking Our Company: O Competitor A Competitor B Competitor C 5 B O C A O B A C O B A C B A O C C B A O O A B C C B A O 4 3 2 1 QFD, Management of Technological Innovation, KV Patri