Download
1 / 35
380 likes | 785 Views
Niche conservatism. Nectar spurs in Aquilegia. Hodges 95. Hodges and Arnold 1995 Proc Roy Soc. Hodges 97 table. Hodges and Arnold 1995 Proc Roy Soc. zygomorphic laterally symmetric. actinomorphic radially symmetric. D>0: 14. D<0: 5. Sargent 2004 Proc. Roy. Soc. London B.

E N D
Nectar spurs in Aquilegia Hodges 95 Hodges and Arnold 1995 Proc Roy Soc.
Hodges 97 table Hodges and Arnold 1995 Proc Roy Soc.
zygomorphic laterally symmetric actinomorphic radially symmetric
D>0: 14 D<0: 5 Sargent 2004 Proc. Roy. Soc. London B.
Parameter estimation on simulated trees, N=500 taxa Maddison et al. 2007 Evolution
Losos 98 Losos et al. 1998 Science
Losos 98 - 2a Losos et al. 1998 Science
Losos 98 - 2a Losos et al. 1998 Science
Losos 98 - 2a Losos et al. 1998 Science
lineage diversity index = sum(obs – exp) positive value = early accumulation of lineages Harmon 03 Harmon et al. 2003 Science
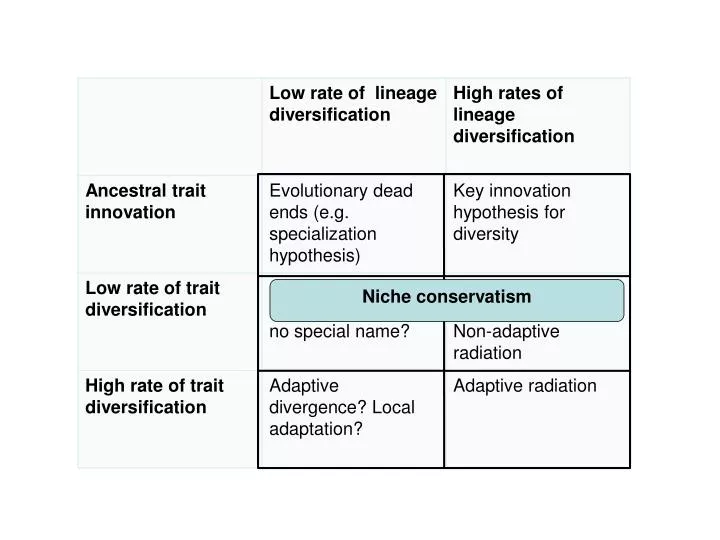
Measuring niche conservatism - phylogenetic signal Blomberg’s K: measures degree of similarity among close relatives, relative to expectations based on Brownian motion convergence brownian conserved K<<1 K~1 K>>1 K: Blomberg et al. (2003) Evolution; examples: Ackerly, PNAS in review
mean subclade disparity/total disparity high values = high within group relative to among group variance = low phylo signal Morphological disparity index = sum(obs-exp): positive values= deep clades span similar trait range, i.e. convergence across clades and low signal Harmon et al. 2003 Science
early diversification -> greater phylogenetic signal Harmon 03-3 Harmon et al. 2003 Science
rate = 0.014 felsens 0.10 felsens 0.79 felsens Diversification of height in maples, Ceanothus and silverswords ~5.2 mya ~30 mya ~45 mya height data: Ackerly, unpubl., Hickman (1993), Wagner (1999) phylogenies: Renner et al .(2008), Hardig et al. (2000), Baldwin & Sanderson (1998)
Are there differences among clades in trait diversification (= disparification) rates Nested ML test: Does a 2 rate model provide a sufficiently better fit than a 1 rate model? O’Meara et al. 2006
change by factor of e million yrs Quantifying rates of phenotypic evolution 1 darwin = Haldane (1949) Evolution; Gingerich (1983) Science
1 Var(loge(trait)) million yrs 1 felsen = time Rates of phenotypic diversification under Brownian motion var(x) Ackerly, PNAS 2009
North temperate California Hawai’i Rates of phenotypic diversification (estimated for Brownian motion model) Height Leaf size ±1 s.e. Rate (felsens) Acer Acer Aesculus Aesculus lobelioids lobelioids Ceanothus Ceanothus Arbutoideae Arbutoideae silverswords silverswords Ackerly, PNAS 2009
Becerra Becerra 2005 PNAS
Lineages-through-time (LTT) plot Becerra LTT Becerra 2005 PNAS
Inga Richardson et al. 2001 Science
Phylica Richardson et al. 2001 Nature