Download
1 / 3
30 likes | 223 Views
Source: Nielsen Consumer & Media View Metro Survey 10 2012 (Jan-Dec12) Base: people 18+ and (outdoor advertising really stands out or usually notice) 4,635,000 people. People 35-54 1,816,000 people (39% of people 18+ who notice outdoor advertising). PEOPLE 35-54. DEMOGRAPHICS

E N D
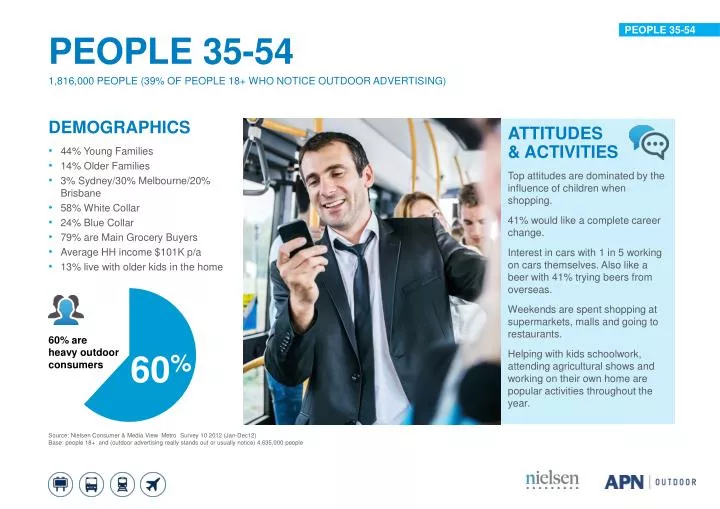
Source: Nielsen Consumer & Media View Metro Survey 10 2012 (Jan-Dec12) Base: people 18+ and (outdoor advertising really stands out or usually notice) 4,635,000 people • People 35-54 • 1,816,000 people (39% of people 18+ who notice outdoor advertising) PEOPLE 35-54 • DEMOGRAPHICS • 44% Young Families • 14% Older Families • 3% Sydney/30% Melbourne/20% Brisbane • 58% White Collar • 24% Blue Collar • 79% are Main Grocery Buyers • Average HH income $101K p/a • 13% live with older kids in the home • ATTITUDES & ACTIVITIES • Top attitudes are dominated by the influence of children when shopping. • 41% would like a complete career change. • Interest in cars with 1 in 5 working on cars themselves. Also like a beer with 41% trying beers from overseas. • Weekends are spent shopping at supermarkets, malls and going to restaurants. • Helping with kids schoolwork, attending agricultural shows and working on their own home are popular activities throughout the year. 60% are heavy outdoor consumers 60%
Source: Nielsen Consumer & Media View Metro Survey 10 2012 (Jan-Dec12) Base: people 18+ and (outdoor advertising really stands out or usually notice) 4,635,000 people • People 35-54 • 1,816,000 people (39% of people 18+ who notice outdoor advertising) • 42% notice advertising on big billboards on my way to the shopping centre PEOPLE 35-54 • MEDIA AND OUTDOOR BEHAVIOUR • Outdoor attitudes/opinions • 58% notice brand advertising on large billboards • 58% say billboard advertising is easy to understand whilst driving • 58% say large billboards capture my attention when driving • 57% can’t miss big billboard signs • 46% can’t help notice advertising around the airport • 47% can’t help notice advertising on busses • 42% notice advertising on big billboards on my way to the shopping centre • Commuting to work/study • 64% travel by car (alone or car pool) • 14% take the bus • 16% use the train • 3% use the tram/light rail • 27% travel an hour or more
Source: Nielsen Consumer & Media View Metro Survey 10 2012 (Jan-Dec12)Base: people 18+ and (outdoor advertising really stands out or usually notice) 4,635,000 people • People 35-54 • 1,816,000 people (39% of people 18+ who notice outdoor advertising) • 69% own a credit card – 46% of them spend $1000 or more a month on their card PEOPLE 35-54 • PURCHASE & INTENTION BEHAVIOUR • Technology • 30% own a laptop only, 23% own a tablet PC, 79% own a smartphone • 1 in 5 run their business from their mobiles, 48% is always contactable for work • Of smartphone owner/users: 28% use Bluetooth, 24% play downloaded games, 20% use it for location based services/GPS, 16% are instant messaging. • 27% intend to purchase a laptop in the next 12 months • 8% intend to purchase a Tablet PC in the next 12 months • Quick Service Restaurants • 54% have takeaway at least fortnightly. 15% have home delivery at least every two weeks • 50% have been to a fast food restaurant in the past week • 27% have visited an independent café in the past week