Download
1 / 31
370 likes | 584 Views
Application of GIS for seed/planting zones and vegetation mapping Examples from Nepal and Kenya. Jens-Peter Barnekow Lillesø Forest and Landscape Denmark. Purpose of presentation:

E N D
Application of GIS for seed/planting zones and vegetation mapping Examples from Nepal and Kenya Jens-Peter Barnekow Lillesø Forest and Landscape Denmark
Purpose of presentation: Suggest a tool for selection of appropriate genetic planting material of indigenous plant species - planting zones based on potential vegetation types Content 1. Seed zoning principles 2. Elaboration of Nepal map – more empirical approach 3. Elaboration of Kenya map – more analytical approach 4. Lessons learnt
Seed zoning history and principles Purpose of seed zoning To enable selection of the most appropriate seed source for planting areas to increase productivity of the planted trees and/or to avoid failure of plantings Why seed zoning is important for tree planting Identification of the best seed source depends on the environment in which it shall grow. A TREE SPECIES IS NOT JUST A SPECIES – IT IS A NUMBER OF POPULATIONS ADAPTED TO THE DIFFERENT GROWING CONDITIONS IN THE AREA OF THE SPECIES’ DISTRIBUTION Seed/Planting zone types General - Thailand, Uganda, Sudan, Indonesia and Burkina Faso – for untested species Species-specific – tested species in temperate countries
Genotype by Environment Interaction (G x E) Genotype by environmentinteraction (in short GXE), means that seed sources change rank when compared in different environments (see A) – the same species but different populations have become adapted to different growing conditions. In the presence of GXE, one cannot identify and use a universal, overall best, seed source for planting, but one has to identify ‘the best seed source for a given type of sites’. Source 1 Source 2 Source 3 fff Ex. Dry Dry Wet Sgasdfgagsgdasgsgagasg Without GXE there is no need for a zoning system from a seed procurement and domestication point of view, the same seed sources can in principle be procured and used everywhere (see B). Source 4 Source 5 Source 6 Ex. Dry Dry Wet
Genotype by Environment Interaction (G x E) GXE reflects that genotypes have different ‘response functions’, i.e. they respond differently to different environments Flexibility Ex. Dry Wet In general, the flatter the seed source curves are (larger C) - the larger (fewer) planting zones can be developed (A) = optimum performance of a seed source at site requirement value (B); (C) = flexibility of a seed source, equivalent to extent of the zone within which the seed source achieves above 80% of its optimum performance. The flexibility is thus the range of sites where a seed source has an acceptable performance (in this case 80% of the optimum) (from Lindgren and Ying, 2000).
Genotype by Environment Interaction (G x E) The G x E patterns of species are unpredictable Group 1: Possible to have only one seed application zone covering all the tested locations Only testing of each species can show which group it belongs to Group 2: Several breeding populations required for good match of seed sources to planting site.
Local seed sources What is a local source? • Local seed sources have grown in environments that are similar to the planting site (source and planting zone may be geographically close by or far away). • A local seed source may not always be the best performer at a given site. • However, finding an alternative, non-local, better seed source requires substantial resources and time (range-wide seed collection, establishment of (maybe repeated) trials in the specific environments, evaluation and analysis). • The long term performance of local seed sources is known and non-local seed sources should therefore in general only be used as alternative to viable local seed sources if the choice is based on solid testing
Using potential vegetation maps as the basis for planting zones • There are about 60,000 species of plants and shrubs on our planet • For around 59,900 species basically no experimental data is available • Their ‘response functions’ and G x E are unknown • Practically all tropical species belong to this group (apart from eucalypts and acacias) • Distribution of vegetation types is an expression of spatial distribution of environmental conditions • Distribution of vegetation types provides information on distribution of indigenous species • Vegetation maps can provide the ’best available’ information on potential sources-matching planting sites
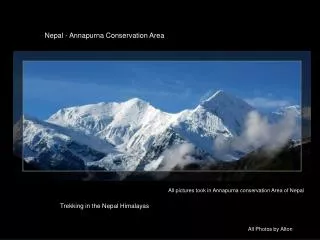
Potential vegetation map Nepal Ecological Zones (and population distribution) Synthesis of vegetation studies carried out over the past 30 years in Nepal – synthesis made possible by GIS
The process – Nepal Vegetation Map • Vegetation map • Botanical field work leading to maps by French/Nepali botanists – 1980s • Production of hardcopy maps (1:250,000) - 1980s • Digitization of maps and transfer onto a digital elevation model • Incorporation phytosociological work by other botanists and correcting errors in maps • Reducing the number of vegetation types (merging of similar types) • Verification of map through checking against plots and published quadrant samples • Climate data • Updating meteorological information from 261 stations • New interpretation of climate and vegetation distribution
Thermal and moisture profiles of ecological zones Climatic information will eventually provide indication of the climatic envelopes of individual species This is the first table that provides climate data for Nepal in a detailed spatial context
Moisture Patterns in Nepal In the literature Nepal is described having a gradual decrease in rainfall from west to east E W Dry Wet Vegetation types and the new climate data show that The sequence is dry wet dry wet
Number of plant species per vegetation type Some vegetation types cover large variation in temperature and moisture in which cases we suggest subdivisions in the planting zone system Number of vegetation types per zone
Example of a species list (species poor type) Species’ detailed information from literature - to be verified Only preliminary lists
Delimiting planting zones in Nepal Example> Schima-Castanopsis Forest type Individual species can be tested in Breeding Seed Orchards (BSOs) if they are in demand by tree planters – experimental information will refine planting zones
Delimiting planting zones in Nepal Example> Lower Tropical Sal (Shorea robusta) Forest type Suggested revision based on climate data Detailed analysis by climate data would Separate this vegetation type into sub-types
Delimiting planting zones in Nepal Vegetation Cover in Lower Tropical Sal Updated forest cover shows what is left of the original vegetation
Delimiting planting zones in Nepal Most tree species are distributed in more than one vegetation type This indicates that the species have populations that are adapted to different environments Bauhinia purpurea occurs in Schima-Castanopis forest type and Hill Sal forest type ~ Two provenances perhaps with different adaption to the environment
Elaboration of Kenya map – a more analytical approach Trapnell and Brunt produced four sheets of a vegetation map for south-western Kenya at a scale of 1:250 000 that mapped vegetation as it was in 1960. We could trace back the large number of vegetation types to the 18 Potential Natural Vegetation type (PNV) Information on climate data were more scanty. Infomation on species in vegetation types were more scanty We also wanted to do a more thorough analysis of climate and vegetation
Kenya map Interpolated data layers Utilised
Ranges and overlap between PNVs Kenya Map length of the segment shows 10% - 90% width of the box the 25%-75% quantiles Range in altitude and precipitation for the 17 potential natural vegetation types
Ranges and overlap between forest PNVs Kenya Map Range in altitude and rainfall for the four forest potential natural vegetation types. length of the segment shows 10% - 90% width of the box the 25%-75% quantiles Considerable overlap in environmental conditions for forest PNVs
Ranges and overlap between PNVs Kenya Map Range in altitude and rainfall for the five bushland or thicket potential natural vegetation types. Some of the types can be clearly differentiated, others have overlap Length of the segment shows 10% - 90% quantiles Width of the box the 25%-75% quantiles
Elaboration of species lists by PNVs • We used five methods of inferences to obtain vegetation-specific species • lists: • information from the legend of the map; • Other information from authors on typical species for forest and bamboo vegetation types; • information from other sources of literature on the vegetation types; • information from herbarium vouchers available from the East Africa Herbarium (based at the National Museums of Kenya); and • information from Beentje (1994) and species lists for particular forest surveys. Test of species in converted PNVs • Current species composition in privately owned land around Mount Kenya resembles the species composition of the original vegetation types (PNVs) • We recommend that future landscape diversification and tree promotion efforts consider original species composition, for which information is available from the new maps and species lists that we produced. • We recommended that future research efforts are dedicated to improving our understanding of species frequency patterns
Lessons learnt • Potential natural vegetation (PNV) • If available, PNV provides a strong tool for development of planting zones of untested species • PNV provides more detailed information than the use of remote sensing alone • PNV provide more detailed information than climate data alone (from weather stations or interpolated) • Due to the coarseness of available climatic data there will often be overlaps and some PNV types will be difficult to separate climatically – these overlaps should be further investigated • Borders between PNV are variable – some narrow (e.g. on mountains) other gradual (in lowlands) – these border need to be tested • Species lists of PNVs should be expanded (rapid vegetation transects) and priority species tested (Breeding Seed Orchards)
References: NEPAL MAP: Lillesø, J-P.B., T.B. Shrestha, L.P. Dhakal, R.P. Nayaju and R. Shrestha. 2005. The Map of Potential Vegetation of Nepal - a forestry/agroecological/biodiversity classifi cation system. Forest & Landscape Development and Environment Series 2-2005 and CFC-TIS Document Series No.110 Lillesø, J.P.B., Dhakal, L.P., Shrestha, T.B., Nayaju, R.P., Shrestha, R. and Kjaer, E.D. 2001. Tree Planting Zones in Nepal - an ecological approach based on vegetation types. DFSC Case Study No.1. TISC Technical Paper No. 103. Danida Forest Centre, Humlebæk. Tree Improvement and Silviculture Component, Kathmandu. Shrestha, T.B., Lillesø, J.P.B., Dhakal, L.P., Shrestha, R. 2002. Forest and vegetation types of Nepal. HMG/Ministry of Forests and Soil Conservation & natural Resources Management Sector Assistance Programme (NARMSAP). TISC Document Series No. 105 KENYA MAP: Kindt, R., Lillesø, J.P. B., van Breugel, P. and Nyabenge, M., 2006. Potential natural vegetation of south-western Kenya for selection of indigenous tree species. Sheets 1-4. World Agroforestry Centre (ICRAF), Nairobi. Kindt, R., van Breugel, P., Lillesø, J.P.B. 2007. Use of vegetation maps to infer on the ecological suitability of species using central and western Kenya as an example. Part 1: Description of potential natural vegetation types for central and western Kenya. Forest & Landscape Denmark and World Agroforestry Centre, Kenya. Forest & Landscape Development Series no 6-2007. Kindt, R., van Breugel, P. and Lillesø, J.P.B. 2006. Use of vegetation maps to infer on the ecological suitability of species using central and western Kenya as an example. Part II. Tree species lists for potential natural vegetation types for Central and western Kenya. Development and Environment Series 7-2007. Roeland Kindt, J.P. B. Lillesø, Paulo van Breugel. 2007. Comparisons between original and current composition of indigenous tree species around Mount Kenya African Journal of Ecology (OnlineEarly Articles). doi:10.1111/j.1365-2028.2007.00787.x van Breugel, P., Kindt, R. and Lillesø, J.P.B. IN PREP (2007). Use of vegetation maps to infer on the ecological suitability of species using central and western Kenya as an example. Part III: Background Study. A comparison of the distribution of potential natural vegetation and environmental conditions in south western Kenya. Forest and Landscape Development and Environment Series 2007 and World Agroforestry Centre, Kenya.