Download
1 / 5
70 likes | 292 Views
C.R.V (Continuous Random Variable). The normal curve is a CRV. Where the variable z can take any value and the probabilities can be worked out. Information does not always give a normal curve, sometimes it gives other curves or a straight line, or a combination.

E N D
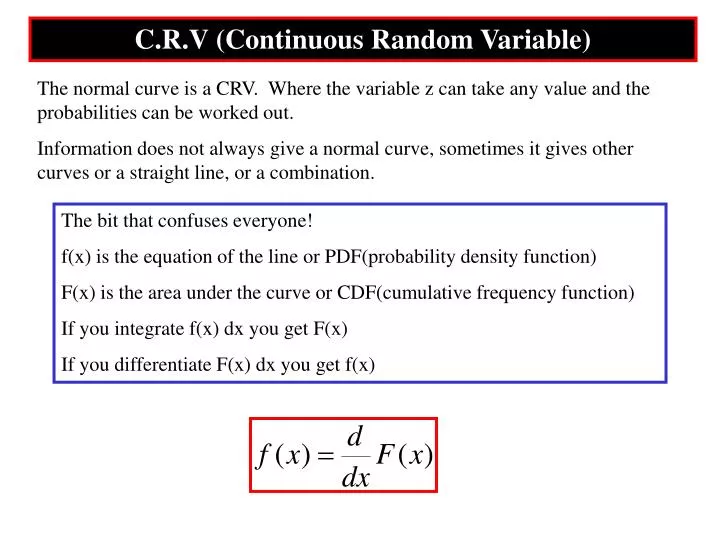
C.R.V (Continuous Random Variable) The normal curve is a CRV. Where the variable z can take any value and the probabilities can be worked out. Information does not always give a normal curve, sometimes it gives other curves or a straight line, or a combination. The bit that confuses everyone! f(x) is the equation of the line or PDF(probability density function) F(x) is the area under the curve or CDF(cumulative frequency function) If you integrate f(x) dx you get F(x) If you differentiate F(x) dx you get f(x)
0.2 0.15 0.1 0.05 0 0 2 4 6 8 10 Minutes late The number of trains that are late are recorded in a histogram. The histogram can be modelled by this line for which we can find a function Frequency Density 0 2 4 6 8 10 Minutes late Note that the area under this curve is 1(we will come back to this later)
A CRV X has PDF: for 1) Sketch the graph of f(x) 2) Show that the area under the curve is 1 3) Find P(X<2) 4) Find P(1.5<X<2.6
A CRV has a PDF 1) Find k 2) Sketch f(x) 3) Find P(1<X<3) 4) Find P(X>2)