Download
1 / 11
110 likes | 199 Views
Introduction to the EMERALD Dataset. Ron Peterson Anne Bergstrom Lucas, Agilent Jean Lozach, Illumina Marc Salit, NIST Russ Wolfinger, SAS Walter Liggett, NIST Jean Thierry-Mieg, NCBI DanielleThierry-Mieg, NCBI. MicroArray Quality Control. Titration working Group.

E N D
Introduction to the EMERALD Dataset Ron Peterson Anne Bergstrom Lucas, Agilent Jean Lozach, Illumina Marc Salit, NIST Russ Wolfinger, SAS Walter Liggett, NIST Jean Thierry-Mieg, NCBI DanielleThierry-Mieg, NCBI
MicroArray Quality Control Titration working Group Ambion Human Brain RNA Stratagene Universal Human RNA Shippy, R. et al, Nature Biotechnology - 24, 1123 - 1131 (2006) 2 EMERALD dataset introduction
MAQC Phase II – Conduct a new titration experiment • Agilent performed a one color analysis of the phase I material. • Added more intermediate titrations to a total of 19 samples. • Total of 80 samples processed • Experiment split up and performed over three days • First day used a mixture of reagent kits. Second day fresh kit. Third day reagents from colleague. 3 EMERALD dataset introduction
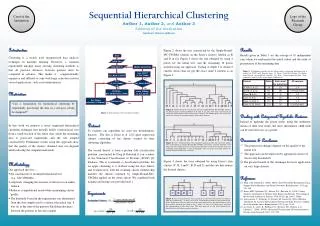
Evaluation of New Agilent Titration. 10 8 14 6 16 6 1 1 18 12 9 2 11 20 19 8 2 3 14 5 5 5 8 19 15 3 9 12 2 15 13 1 4 10 5 13 6 13 4 18 12 16 18 16 17 4 19 18 3 15 11 2 1 12 16 19 17 9 8 14 7 20 10 0 Discriminate Coordinate 2 -5 -10 11 20 -15 5 3 7 11 7 13 10 15 4 6 17 20 9 7 10 14 17 -20 -10 0 10 Discriminate Coordinate 1 Clustering of the arrays by amplify-label date. 3/2, 3/6, 4/10, 4/12 4 EMERALD dataset introduction
Sample information for Biological vs Technical variation study. Animal: Rattus norvegicus Strain: Sprague Dawley Crl:CD(SD) Age: 7-8 weeks Sex: Male Treatment: 20% propylene glycol/80%/lactic acid containing 4.3% mannitol, pH 4.0 Duration : intravenous, once per week for 13 weeks Number: 6 5 EMERALD dataset introduction
Study Design • Each Sample was performed in triplicate • eg, 1-A-1, 1A-2, 1-A3, etc. • Each sample was placed into a single well of a 96 well plate in a randomized pattern. • Remaining wells were filled with samples made from pooling animals. • 1-3A, B, C, D & 4-6A, B, C, D; single samples. • 1-6A, B, C, D; each sample repeated 4 times on plate. • 3 duplicate plates were produced and one plate was processed on; • Affymetrix Rat Genome U133 plus 2.0 arrays • Agilent Whole Rat Genome Oligo Microarray (4x44K) [G4131F] • Illumina RatRef-12 v1 Expression BeadChip 6 EMERALD dataset introduction
Affymetrix Study design • Chip performed at the Novartis Institutes for Biomedical Research • 96 well plate was processed on an Affymetrix GCAS robot. • 96 chips were washed on 12 Fluidics Machines (48 chip lots). • 48 chips lots were scanned on one of two Affymetrix Scanner. • Technical variation parameters. • Sample plate location. • Affymetrix chip lot. • Fluidics station location. • Scanner used. • Day processed (8 of the 96 chips were processed on a different date by rehybridizing the hybridization mix on a new chip. 7 EMERALD dataset introduction
Agilent Study Design • Chips were processed at Agilent. • 2 different technicians processed the arrays. • 12 chips (48 arrays) were processed on 2 different days • A single scanner was used. • Technical variation parameters • Technician. • Day processed. • Chip and reagent lots. • Substrate. • Starting total RNA amount (400 ng vs 200 ng). 8 EMERALD dataset introduction
Illumina Study Design • Chips were processed at Asuragen (service provider). • 2 different technicians processed the arrays. • 8 chips (96 arrays) were processed on 4 different days with 4 different kits. • A single scanner was used. • Technical variation parameters • Technician. • Day processed. • Chip and reagent lots. • Location on the chip. • cRNA yield. 9 EMERALD dataset introduction
Data Access links • The data and supporting material are available from ArrayExpress • Affymetrix • http://www.ebi.ac.uk/microarray-as/aer/result?queryFor=Experiment&eAccession=E-TABM-536 • Agilent • http://www.ebi.ac.uk/microarray-as/aer/result?queryFor=Experiment&eAccession=E-TABM-555 • Illumina • http://www.ebi.ac.uk/microarray-as/aer/result?queryFor=Experiment&eAccession=E-TABM-554 10 EMERALD dataset introduction
Current Plans of MAQC Phase II Titration Group • Jean and Danielle Thierry-Mieg (NCBI) have done a complete annotation of the rat genes in AceView and identified the alternative transcripts tested on all three rat arrays. http://www.aceview.org/index.html?rat • The mapping, available atftp://ftp.ncbi.nlm.nih.gov/repository/acedb/rat, will be used to identify the groups of probes from the three array platforms testing the same transcripts and genes. • We will use this correspondence to contrast the performance of the arrays in their ability to identify biological and technical variation. 11 EMERALD dataset introduction