Download
1 / 12
120 likes | 253 Views
Spectral Range and Resolution. Huan Lin Fermilab. Wavelength range and redshift coverage. Wavelengths 5500 Å 6000 Å 10000 Å Emission line redshifts [OII] 3727 0.48 0.61 1.68 [OIII] 5007 0.10 0.20 1.00 H 6563 N/A N/A 0.52

E N D
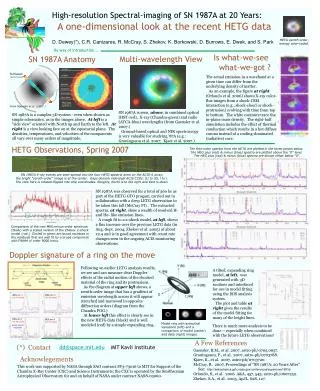
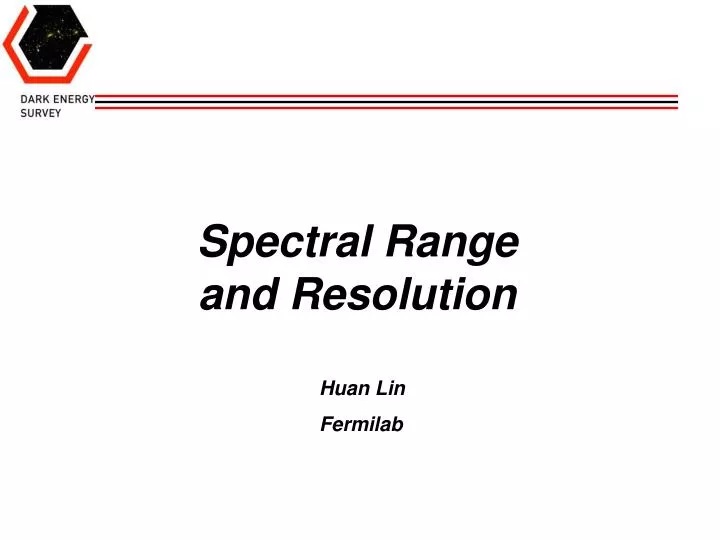
Spectral Range and Resolution Huan Lin Fermilab
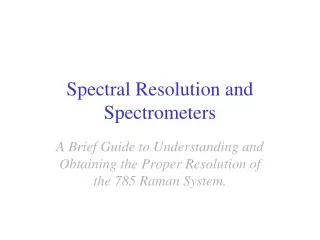
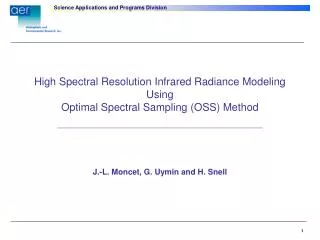
Wavelength range and redshift coverage • Wavelengths 5500 Å 6000 Å 10000 Å • Emission line redshifts • [OII] 3727 0.48 0.61 1.68 • [OIII] 5007 0.10 0.20 1.00 • H 6563 N/A N/A 0.52 • For nominal 6000-10000 Å spectral range, the emission line galaxy redshift coverage is z = 0-0.52 with H and z = 0.61-1.68 with [OII] 3727 • Gap from z = 0.52-0.61 can be partly filled using [OIII] 5007 for strong emission line galaxies (as [OIII] 5007 is a weaker line in general) • Absorption line redshifts • Ca H+K 3950 0.39 0.52 1.53 • G band 4300 0.28 0.40 1.33 • Mg 5170 0.06 0.16 0.93 • Na 5892 N/A 0.02 0.70 • LRG redshift coverage is about z = 0.52-1.33 using both Ca H+K and G band • Lower redshifts can be reached by Mg and Na features, but in detail will use simulations to assess redshift success rates
Wavelength range vs. emission line redshift coverage
Wavelength range vs. absorption line redshift coverage
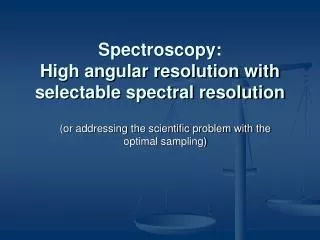
Night Sky Spectra • High-resolution (R 45000) night sky spectral atlas (Hanuschik 2003) derived from echelle spectroscopy using the UVES instrument on VLT • Wavelength coverage 3140-10430 Å • Data restricted to dark sky conditions • Resolution much higher than for DESpec and so good for S/N forecasts • Before had used Mauna Kea night sky spectrum from Gemini website, but that looks like it’s effectively very low resolution (tens of Å?), even though it’s tabulated with spacing of a few Å • Not good for forecasts at full DESpec resolution
UVES sky resolution comparison R 9000 at 9000 Å
UVES sky resolution comparison R 3600 at 9000 Å
UVES sky resolution comparison R 2200 at 9000 Å (~SDSS)
Example S/N calculations • Consider simple cases of • Galaxy with constant AB mag = 21.5 continuum • Unresolved emission line with flux = 1.0 x 10⁻¹⁷ erg/s/cm2 • S/N calculation assumptions • 2-arcsec diameter fiber, with 70% of light entering fiber (based on galaxy sizes in DECam image simulations) • Throughput simply taken as 50% of DECam (for now), at airmass = 1.3 • 30 min exposure time • UVES night sky spectrum • S/N calculated in fixed resolution element bins of 2.5 Å, corresponding to resolution R = 3600 at 9000 Å • Working on IDL simulation package (C. Cunha & H. Lin) that simulates 1D extracted spectra, based on input mock galaxy catalogs and template spectra, throughput components, resolution, and night sky data • Will compute S/N using outputs, as well as run cross-correlations using IRAF rvsao package to compute redshift success rates in detail as functions of galaxy magnitude, color, redshift, and emission line strength
S/N for continuum w/ constant AB mag = 21.5 R 3600 at 9000 Å
S/N for emission line with flux = 1.0x10⁻¹⁷ erg/s/cm2 R 3600 at 9000 Å