Download
1 / 41
430 likes | 696 Views
Risk, Returns, and Risk Aversion. Return and Risk Measures Real versus Nominal Rates EAR versus APR Holding Period Returns Excess Return and Risk Premium Variance Sharpe Ratio Risk Aversion and Capital Allocations Risk Aversion and Utility Function Capital allocation line

E N D
Risk, Returns, and Risk Aversion • Return and Risk Measures • Real versus Nominal Rates • EAR versus APR • Holding Period Returns • Excess Return and Risk Premium • Variance • Sharpe Ratio • Risk Aversion and Capital Allocations • Risk Aversion and Utility Function • Capital allocation line • Optimal Allocations Risk, Return and Risk Aversion
Road map in this and the next lecture • Risk and return • Optimal allocation given risk and return tradeoff • Two-asset allocation • Efficient frontier • Multiple asset allocation • Capital asset pricing models (CAPM) • Arbitrage pricing theory (APT) • Fama-French three-factor model Risk, Return and Risk Aversion
Nominal and Real Rates • Nominal rate • Real rate Risk, Return and Risk Aversion
Example 5.2 Annualized Rates of Return Risk, Return and Risk Aversion
Formula for EARs and APRs See page 128-129 Risk, Return and Risk Aversion
Rates of Return: Single Period HPR = Holding Period Return P0 = Beginning price P1 = Ending price D1 = Dividend during period one Risk, Return and Risk Aversion
Rates of Return: Single Period Example Ending Price = 48 Beginning Price = 40 Dividend = 2 HPR = (48 - 40 + 2 )/ (40) = Risk, Return and Risk Aversion
Excess Return • Risk free rate • Excess return • Also known as risk premium Risk, Return and Risk Aversion
Scenario or Subjective Returns: Example StateProb. of State r in State .1 -.05 .10 2 .2 .05 3 .4 .15 4 .2 .25 5 .1 .35 E(r) = Risk, Return and Risk Aversion
Variance or Dispersion of Returns Standard deviation = [variance]1/2 Using Our Example: Var= Risk, Return and Risk Aversion
Mean and Variance of Historical Returns Arithmetic average or rates of return Risk, Return and Risk Aversion
Geometric Average Returns TV = Terminal Value of the Investment g= geometric average rate of return Risk, Return and Risk Aversion
Sharpe Ratio Sharpe Ratio for Portfolios= Measure of risk-return tradeoff Other concepts: Skewness and Kurtosis – page 142-143 Check out the statistics from page 147-151 Risk, Return and Risk Aversion
Page 187 Risk, Return and Risk Aversion
Figure 5.4 The Normal Distribution Risk, Return and Risk Aversion
Figure 5.4 The Normal Distribution Risk, Return and Risk Aversion
Normality and Risk Measures Risk, Return and Risk Aversion • What if excess returns are not normally distributed? • Standard deviation is no longer a complete measure of risk • Sharpe ratio is not a complete measure of portfolio performance • Need to consider skew and kurtosis
Skew and Kurtosis Skew Kurtosis Equation 5.20 Risk, Return and Risk Aversion Equation 5.19
Figure 5.5A Normal and Skewed Distributions Risk, Return and Risk Aversion
Figure 5.5B Normal and Fat-Tailed Distributions (mean = .1, SD =.2) Risk, Return and Risk Aversion
Value at Risk (VaR) Risk, Return and Risk Aversion • A measure of loss most frequently associated with extreme negative returns • VaR is the quantile of a distribution below which lies q % of the possible values of that distribution • The 5% VaR , commonly estimated in practice, is the return at the 5th percentile when returns are sorted from high to low.
Expected Shortfall (ES) Risk, Return and Risk Aversion • Also called conditional tail expectation (CTE) • More conservative measure of downside risk than VaR • VaR takes the highest return from the worst cases • ES takes an average return of the worst cases
Lower Partial Standard Deviation (LPSD)and the Sortino Ratio Risk, Return and Risk Aversion • Issues: • Need to consider negative deviations separately • Need to consider deviations of returns from the risk-free rate. • LPSD: similar to usual standard deviation, but uses only negative deviations from rf • Sortino Ratio replaces Sharpe Ratio
Historic Returns on Risky Portfolios Risk, Return and Risk Aversion Returns appear normally distributed Returns are lower over the most recent half of the period (1986-2009) SD for small stocks became smaller; SD for long-term bonds got bigger
Historic Returns on Risky Portfolios Risk, Return and Risk Aversion Better diversified portfolios have higher Sharpe Ratios Negative skew
Figure 5.10 Annually Compounded, 25-Year HPRs Risk, Return and Risk Aversion
Risk Aversion • Risk Aversion • Risk Love • Risk Neutral • Utility function Risk, Return and Risk Aversion
Utility Function Utility Function: U = E ( r ) – 1/2 A σ2 Where U = utility E ( r ) = expected return on the asset or portfolio A = coefficient of risk aversion σ2 = variance of returns Risk, Return and Risk Aversion
Computing Utility Scores If A=2, then See page 168 Risk, Return and Risk Aversion
Figure 6.2 The Indifference Curve Page 166, Table 6.3 Risk, Return and Risk Aversion
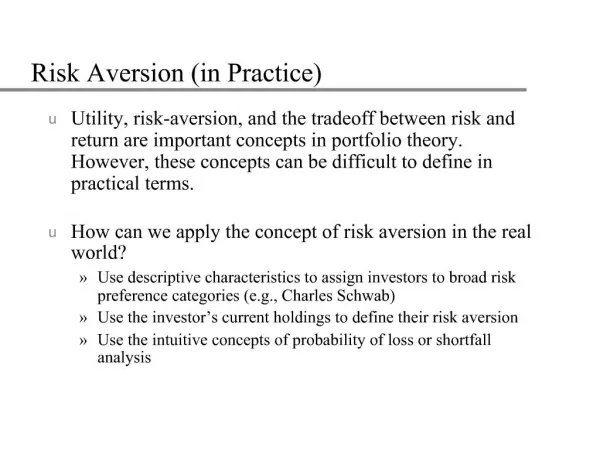
Allocating Capital: Risky & Risk Free Assets • It’s possible to split investment funds between safe and risky assets. • Risk free asset: proxy; T-bills • Risky asset: stock (or a portfolio) Risk, Return and Risk Aversion
Example Using Chapter 6.4 Numbers The total market value of an initial portfolio is $300,000, of which $90,000 is invested in the Ready Asset money market fund, a risk-free asset. The remaining $210,000 is invested in risky securities – $113,400 in equity and $96,600 in long-term bonds. Find the distribution of this portfolio. Risk, Return and Risk Aversion
E(rc) = yE(rp) + (1 - y)rf rc = complete or combined portfolio For example, y = .75 E(rc) = Expected Returns for Combinations Risk, Return and Risk Aversion
If y = .75, then = c If y = 1 = c If y = 0 = c Combinations Without Leverage Risk, Return and Risk Aversion
Capital Allocation Line with Leverage Borrow at the Risk-Free Rate and invest in stock. Using 50% Leverage, rc = (-.5) (.07) + (1.5) (.15) = .19 c = (1.5) (.22) = .33 Risk, Return and Risk Aversion
Table 6.5 Utility Levels Risk, Return and Risk Aversion
Optimal Portfolio • Maximize the mean-variance utility function • U=E(R)-1/2Aσ2 • Based on the expressions for expected return and σ, we have the expression for optimal allocation y*: • Example 6.4 (page 175): Risk, Return and Risk Aversion
Figure 6.6 Utility as a Function of Allocation to the Risky Asset, y Risk, Return and Risk Aversion
Figure 6.7 Indifference Curves for U = .05 and U = .09 with A = 2 and A = 4 Risk, Return and Risk Aversion
Optimal Complete Portfolio on Indifference Curves Risk, Return and Risk Aversion