Download

1 / 59
590 likes | 860 Views
ROOT. An object oriented HEP analysis framework. ROOT contacts at Fermi. Philippe Canal , x2545 pcanal@fnal.gov Suzanne Panacek, x8334 spanacek@fnal.gov Jeff Kallenbach, x2545 jefk@fnal.gov. Object Oriented Concepts. Class: the description of a “thing” in the system

E N D
ROOT An object oriented HEP analysis framework.
ROOT contacts at Fermi • Philippe Canal , x2545 pcanal@fnal.gov Suzanne Panacek, x8334 spanacek@fnal.gov • Jeff Kallenbach, x2545 • jefk@fnal.gov 2
Object Oriented Concepts • Class: the description of a “thing” in the system • Object: instance of a class • Methods: functions for a class • Members: a “has a” relationship to the class. • Inheritance: an “is a” relationship to the class. 3
The Object Oriented Frame Work The ROOT framework consists of over 350 C++ classes. Class Categories: 1. Base Classes 2. Container Classes 3. Histograms and Minimization Classes 4. Tree and Ntuple Classes 5. Linear Algebra, Matrix, and Vector Classes 6. 2D & 3D Graphics Classes 4
ROOT’s Class Categories (cont.) 7. GUI Classes 8. Operating System Interface 9. Networking Classes 10. Documentation Class 11. Interactive Interface 12. PROOF Server See: www/roothttp://root.cern.ch/root/Categories.html 5
Advantages over PAW (from a PAW user’s point of view) • Interactive User Interface • Uses a regular grammar for commands (C++) • Better documentation • Faster and less space consuming I/O • Object Oriented • Additional features • Rotate lego plot • Setting attributes on a histogram basis • Saving objects (i.e. Events, Tracks) 7
Three Ways to Use ROOT • GUIwindows, buttons, menus • Root Command lineCINT (c++ interpreter) • Macros, applications, libraries. 8
What We Will Cover Today • GUI • Browser • Tree Viewer • Command line basics • Macros • 2 Examples • Other • convert a PAW file • how to find more info 9
Class Schedule Session 1: ROOT file and GUI overview Exercise #1 Session 2: Tree Viewer Exercise #2 Break Session 3: How to find more information Exercise #3 Session 4: Macros Exercise #4 Q&A and Feedback 10
The ROOT file • A directory structure like UNIX • Items in a directory can be: • subdirectory • objects (canvas, histograms, etc.) • root trees 11
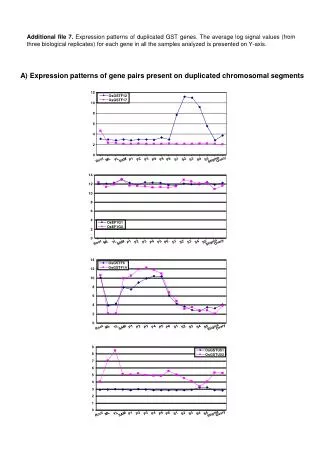
From Raw Data to a ROOT Tree • 1. Raw Data: x1, x2, x3, n=10,000 • 2. Column wise Ntuple • 3. ROOT Tree 12
Getting Started with the GUI • Start root • > root • Quit root (just in case) • root[0]>.q • Display the browser • new TBrowser(); 13
Displaying a Histogram Open the root file Browse the file • Display a histogram • The Canvas 14
Basic Navigation by Clicking • Left Click • select the object • drag the object • resize the object • Right Click • context menu • class::name • methods • Middle Click • activate canvas • freezes event status bar 15
Cursor Types • Hair- line crossDefault cursor, nothing is selected • Bold crossObject is selected (the Object can be dragged) • Arrow with a Horizontal Line on top or bottom • Expand the object towards the top or bottom. • Arrow with Vertical Line on left or right • Expand the object toward the left or right • Arrow pointing into a corner • Expand the object's size (keeping the aspect ratio) • PointerReady to select a histogram, a Fit is selected, an • end point of an arrow is selected. • HandReady to select an axis point or function object. • WatchBusy • Rotating ArrowsReady to rotate a 3-D view or a text 16
The Draw Panel • The Event Status • The Draw Panel • Adding Error bars • Defaults 17
Fitting, Coloring, and Zooming • Adding a gaussian fit • Coloring the histogram • Zooming 18
Adding Objects to the Canvas • The Editor • Adding an Arrow • Adding Text 19
Adding another Pad • Add a Pad • Select the new Pad • Draw a histogram • Add a title for the axis 20
Modifying the Statistics • The Canvas in the Browser • Setting the statistics options 21
Summary of Session 1 • Overview of Root • GUI Basics • Displaying Histograms • The Draw Panel • The Fit Panel • Fill Attributes • Zooming • Adding a title for the axis • Modifying Statistics • Adding Objects to the Canvas 22
Getting started with the Exercises • Login at the PC with the password “training” • Find the ROOT folder on the desktop and the Exceed clients. Use Exceed to log in. • Start Netscape from the Unix prompt, and get the example files and macros: www-pat.fnal.gov/root/101 • Setup the correct root version (see hand outs). 23
Exercise #1 Create this histogram. 24
Dividing the Canvas • Create a new Canvas • Divide it in 2 • Draw two histograms. 1. Lego plot 2. LogY 25
The Tree Viewer Tree Viewer buttons: • Variables • Slider • XYZ • Draw, Scan, Break • Ilist, Olist • Gopt • Weight/Selection • Record 26
Drawing Histograms • Draw one variable • Draw another variable • Draw both using the “same” option 27
Adding Weight Add a Weight: xmain < 0 28
2D Lego Plots • Draw xmain vs. xs1 • Rotating the lego plot 29
Creating a variable • 1. CreateNewVar • 2. Set the name and expression • 3. Draw it 30
Recording Commands • If the REC. button is enabled (red) the command: • Is recorded in history file ($HOME/root_hist) • Is printed on the REC. button box • Is printed on the command line • Press REC. to disable it (gray) myTree->Draw("xs1", "", "", 10000, 0); myTree->Draw("xmain", "", "same", 10000, 0); myTree->Draw("xs1", "xmain < 0", "same", 10000, 0); myTree->Draw("xs1:xmain", "", "lego", 10000, 0); 31
Saving the Canvas • The save options: • Postscript • gif • ROOT file • Macro • Save as a ROOT file: • Open the saved ROOT file (c1.root) and draw the canvas • root[2] > c1.Draw(); 32
Saving the Canvas As a Macro • Saving the canvas as a macro: • 1. Save the canvas objects in c1.C • 2. Save the histogram in a root file • root [4] TH1* htemp = (TH1*)gROOT->FindObject("htemp");root [5] htemp->Print() ; // verify if its the right oneTH1.Print Name= htemp, Total sum= 10000root [6] TFile * f = new TFile("histfile.root","RECREATE");root [7] htemp->Write();root [8] f->Close(); • 3. Open the file before running c1.C • root [0] TFile * f = new TFile("histfile.root","READ"); • root [1] .X c1.C • Explore the history file • $HOME/.root_hist 33
Summary of Session 2 • Dividing the Canvas • Lego Plots • The LogY option • The Tree Viewer • Drawing multiple Histograms • Adding Weight • 2D Lego Plot • Creating a new variable • Saving a canvas 34
Exercise #2 Create two canvases with these lego plots. 35
Where to Find Information • The ROOT Home: http://root.cern.ch • Talks and publications on ROOT:http://root.cern.ch/root/Publications.html • To get information on a specific class :http://root.cern.ch/root/html/ClassIndex.html 36
Classes and Members Reference Guide • Find the class in the index, for example TFile. • Class Inheritance class TFile : public TDirectory • Class Description • Private members • Public methodsvirtualvoidDelete(Text_t* namecycle) • Code 37
Finding Examples • The ROOT Tutorials: http://root.cern.ch/root/Tutorials.html • The ROOT How To's: http://root.cern.ch/root/Howto.html • For on-line help for a particular topic it's very useful to use their facility to search the ROOT site. http://root.cern.ch/root 38
Example: How do I read an ASCII file • Search for “reading ASCII” on the ROOT website • Go to the example 39
More Information • To subscribe to roottalk: http://root.cern.ch/root/roottalk/AboutRootTalk.html • To submit a bug report:http://pcroot.cern.ch/root-bugs • About ROOT at Fermihttp://ods.fnal.gov/ods/root-eval/current/ 40
PAW to ROOT File Conversion • Get the example PAW file fromhttp://www-pat.fnal.gov/root/101/toyz.rz • At the system prompt type • :> h2root toyz.rz toyz.root • Once you've done the conversion, you can then start up a ROOT session and open the ROOT file that you have created. • Also see: http://root.cern.ch/root/HowtoConvert.html 41
Summary of Session 3 • Where to find Class definitions • Where to find macro examples • How to search • How to submit a bug report 42
Exercise #3 • Find the options for Drawing 1D and 2D histograms. 43
The ROOT Command Line • C++ syntax for example:root:>TBrowser * b = new TBrowser(); • All CINT commands start with “.” • root:>.? • this command will list all the CINT commands • root:>.X [filename] • load [filename] and execute function [filename] • root:>.L [filename] • load [filename] • All SHELL commands start with “.!” for example:root:> .! ls 44
Command Line Help Use the Tab feature to get help ... > b = new TB<TAB> > b= new TBrow<TAB> > b=new TBrowser(<TAB> Use the up arrow to recall commands Use emacs commands to navigate on the command line 45
Un-named Macros // un named macro start with “{“ and end with “}” { // Create a new histogram TH1F *myHistogram = new TH1F("myHistogram","Random Numbers",100,0,1); // Use the random number generator gRandom->SetSeed(); // Fill the Histogram with 5000 events for ( Int_t i=0; i < 5000; i++) myHistogram->Fill(gRandom->Rndm(1)); // Draw the histogram. // ROOT will automatically create a canvas myHistogram->Draw(); } 46
Named Macro Example Creates the file used in Session #1 (Example.root) 1. Fill 4 histograms with random numbers 2. Draw the histograms 3. Create a Tree with a branch for each variable 4. Write the file 47
Example.C // named macro function to execute void Example(Int_t nfill=10000, UInt_t seed=0) { Float_t xs1, xs2, xmain; TFile *hfile; TTree *tree; TBranch *xmainBranch; TBranch *xs1Branch; TBranch *xs2Branch; TCanvas *theCanvas; TH1F *totalHistogram; TH1F *mainHistogram; TH1F *s1Histogram; TH1F *s2Histogram; 48
Example.C - creating a Tree // Create a file hfile = new TFile("Example.root","RECREATE","ROOT file"); // Create the tree branches, one for each variable tree = new TTree("myTree","Example ROOT tree"); xmainBranch = tree->Branch("xmain", &xmain, "xmain"); xs1Branch = tree->Branch("xs1", &xs1, "xs1"); xs2Branch = tree->Branch("xs2", &xs2, "xs2"); 49
From Raw Data to a ROOT Tree • 1. Raw Data: x1, x2, x3, n=10,000 • 2. Column wise Ntuple • 3. ROOT Tree 50
Example.C - creating histograms // Create the canvas theCanvas = new TCanvas ("TheCanvas","Example",200,10,600,400); theCanvas->SetGrid(); // Create some histograms totalHistogram = new TH1F ("totalHistogram","Total Distribution",100,-4,4); mainHistogram = new TH1F ("mainHistogram ","Main Contributor", 100,-4,4); s1Histogram = new TH1F ("s1Histogram", "First Signal", 100,-4,4); s2Histogram = new TH1F ("s2Histogram", "Second Signal", 100,-4,4); 51