Download
1 / 60
600 likes | 621 Views
Explore forward azimuthal angle di-hadron correlations in PHENIX with Beau Meredith from UIUC. Discover insights from RHIC, theory motivation, PHENIX detector subsystems, correlation measurements, and interpretation of results. Uncover the signatures of Color Glass Condensate and its effects at RHIC, including gluon saturation and nuclear enhancements in di-hadron correlations. The PHENIX detector at RHIC features various subsystems like central arms, muon arms, and Muon Piston Calorimeter. Learn about azimuthal angular correlations, forward rapidity measurements, and quantifying suppression in d+Au collisions. The study delves into the complexity of gluon saturation effects, angular decorrelations, and nuclear modification factors. Gain a comprehensive understanding of the color glass condensate phenomenon and its implications in high-energy physics research.

E N D
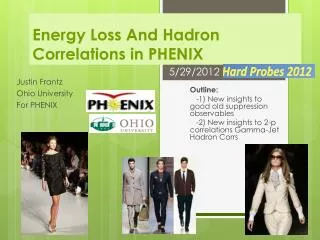
Signatures of Color Glass Condensate: Forward Azimuthal AngleDi-Hadron Correlations in PHENIX Beau Meredith (UIUC) For the PHENIX Collaboration 2010 CGC Workshop What we have learned from RHIC
Outline • Theory Motivation • PHENIX Detector Subsystems • Two-particle Correlation Measurements • Results and Interpretation • Published RHIC Run3 d+Au • New RHIC Run8 d+Au • Outlook
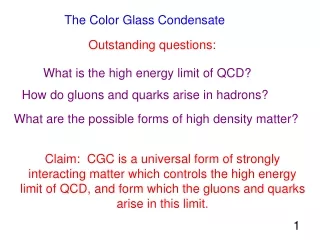
The Color Glass Condensate See Yu.V. Kovchegov, Phys. Rev. D 61, 074018 (2000). For review, see F. Gelis, E. Iancu, J. Jalilian- Marian, R. Venugopalan, arXiv:1002.0333 gluon density saturates for large densities at small x : Non-linear evolution eqn. diffusion g-g merging g emission • g-g merging large if • saturation scale, Qs • nuclear enhancement ~ A1/3 • increasing gluon density~ 1/xl Mechanism for gluon saturation
CGC Effects at RHIC ( = 200 GeV) pT is balanced by many gluons dilute parton system, deuteron dense gluon field , Au Gluon distribution function from HERA • Probe low x gluons at forward rapidities • Usedeuteron-gold (d+Au) collisions vs p+p • Difference is nuclear enhancement factor in saturation scale, A1/3 • Signatures of CGC • suppression of nuclear modification factors • angular decorrelations of di-jet signals (di-hadron Df correlations) • Disappearance of the away-side peak in when Q2 ~ Qs2 F.D. Aaron et al, [H1 Collaboration] Eur. Phys. J. C 64, 561 (2009)
Outline • Theory Motivation • PHENIX Detector Subsystems • Two-particle Correlation Measurements • Results and Interpretation • Published RHIC Run3 d+Au • New RHIC Run8 d+Au • Outlook
PHENIX Detector at RHIC • Central Arms | η | < 0.35 • Charged hadrons • Neutral pions / η • Heavy Flavor electrons • Direct Photon • J/Psi • Muon Arms 1.2 < | η | < 2.4 • Unidentified charged hadrons • Heavy Flavor muons • J/Psi • Muon Piston Calorimeter • 3.1 < | η | < 3.9 • Neutral pions / η
PHENIX Muon Piston Calorimeter PbWO4 Density 8.28 g/cm3 Size 2.2x2.2x18 cm3 Length 20 X0, 0.92 Weight 721.3 g SOUTH NORTH Moliere radius 2.0 cm Radiation Length 0.89 cm Interaction Length 22.4 cm Light Yield ~10 p.e./MeV @ 25 C Temp. Coefficient -2% / C Radiation Hardness 1000 Gy Main Emission Lines 420-440, 500 nm Refractive Index 2.16 Small cylindrical hole in Muon Magnet Piston, Radius 22.5 cm and Depth 43.1 cm
MPC MPC • MPCs installed in 2005-2006 • Increase PHENIX acceptance for calorimetry by a factor of 4 (with a detector more than 10 times smaller) PHENIX Acceptance South Muon Tracker North Muon Tracker EMCAL + Central Tracker 0 f coverage 2p EMCAL + Central Tracker -3 -2 -1 0 1 2 3 rapidity
Forward Muon Piston Calorimeters p0 ID up to E ~ 20 GeV with MPCs (3.1 < |h| < 3.9) Limitations: tower separation and merging effects Use p0s for 7 GeV < E < 22 GeV pT max ~ 2 GeV/c Use event mixing to subtract bg Single Clusters for E > 15 GeV Dominated by p0 (~ 85%) Access higher pT Merged p0gg p0gg 11 < E < 15 Foreground Event Mixed Background Yield Mgg (GeV/c2) North MPC
Outline • Theory Motivation • PHENIX Detector Subsystems • Two-particle Correlation Measurements • Results and Interpretation • Published RHIC Run3 d+Au • New RHIC Run8 d+Au • Outlook
Azimuthal Angular Correlations • Measure Df of all particle pairs • Define trigger particle (basically the leading pTparticle – indicates jet) and associate particle (lower pT) trigger Beam view Df associate • Signals of saturation are suppression and/or broadening of away-side peak in d+Au relative to p+p • p+p, d+AuCentral rapidity correlations are similar (RHIC Run3) Dh=0 is similar for d+Au (closed) and p+p (open) Near-side Away-side S.S Adler et al, Phys. Rev. C 73:054903,2006.
Forward Rapidity Correlations • Use PHENIX forward detectors • New results from RHIC run8sNN= 200 GeV • d+Au (Lint=80 nb-1) • p+p (Lint=5.2 pb-1) from RHIC Run8 • Measure two sets of different angular correlations • Rapidity-separated (forward/central) • Predicted to be sensitive to saturation effects in d+Au • Both particles forward (forward/forward) • Lowest x (strongest test for saturation in d+Au) p+p, Dh=3.4 D. Kharzeev, E. Levin, L. McLerran, Nucl.Phys.A748:627-640,2005 Df
How do we Quantify Suppression? • “ConditionalYield” • Number of di-jet particle pairsper trigger particle • Possible indicators of gluon saturation • IdA < 1 • Angular decorrelation of widths Peripheral d+Au Correlation Function Acceptance x efficiency Npair Nuclear Modification factor Df
Outline • Theory Motivation • PHENIX Detector Subsystems • Two-particle Correlation Measurements • Results and Interpretation • Published RHIC Run3 d+Au • New RHIC Run8 d+Au • Outlook
IdA from the PHENIX Muon Arms Observations at PHENIX using the 2003 d+Au sample: Left: IdA for hadrons1.4 < |h| < 2.0 , PHENIX muon arms. correlated with h+/- in |h| < 0.35, central arms. Right: Comparison of conditional yields with different trigger particle pseudo-rapidities and different collision centralities No significant suppression or widening seen within large uncertainties! pTa, h+/- pTt, hadron 0-40% centrality 40-88% centrality IdA Trigger pT range IdA pTassociated Phys.Rev.Lett. 96 (2006) 222301
Outline • Theory Motivation • PHENIX Detector Subsystems • Two-particle Correlation Measurements • Results and Interpretation • Published RHIC Run3 d+Au • New RHIC Run8 d+Au • Outlook
sNN= 200 GeV d+Au Collision d Au PHENIX central spectrometer magnet Muon Piston Calorimeter (MPC) Forward direction (North) Backward direction (South) Side View
sNN= 200 GeV d+Au Collision PHENIX central spectrometer magnet Muon Piston Calorimeter (MPC) d Au Forward direction (North) Backward direction (South) Side View
Forward Di-jet Signal with Dh = 3.4 Mostly Merged p0s PHENIX central spectrometer magnet Muon Piston Calorimeter (MPC) p0 or clusters xgluon ~ 10-2 Nuclear enhancement Au effective xgluon ~ 10-3 Forward direction (North) Backward direction (South) p0 or h+/- Side View
p0 (trigger,central)/p0 (associate,forward) <pTa>=0.55 GeV/c <pTa>=0.77 GeV/c <pTa>=1.00 GeV/c 2.0 < pTt < 3.0 GeV/c pp dAu 0-20% Correlation Function dAu 60-88% pTt, p0 pTa,p0 Df
p0 (trigger,central)/cluster (associate,forward) <pTa>=1.09 GeV/c <pTa>=2.00 GeV/c <pTa>=3.10 GeV/c 2.0 < pTt < 3.0 GeV/c pp dAu 0-20% Correlation Function dAu 60-88% pTt, p0 pTa,p0 Df
Dh = 3.4 Correlations: Widths • No significant broadening between p+p and d+Au within large experimental uncertainties Trigger p0: |h| < 0.35,3.0 < pT < 5.0 GeV/c Trigger p0: |h| < 0.35,2.0 < pT < 3.0 GeV/c • p+p • d+Au 0-20 • d+Au 40-88 Two Cluster p0 (closed) Single Cluster (open) dAu 0-20% pp dAu 40-88%
Dh = 3.4 Correlations: IdA Associate p0: 3.1 < h< 3.9, 0.45 < pT < 1.59 GeV/c • IdA for central triggered events for reconstructed p0 • Increasing suppression of IdA reaches a factor 2 for central events • Indicates di-jet suppression
sNN= 200 GeV d+Au Collision PHENIX central spectrometer magnet Muon Piston Calorimeter (MPC) d Au Forward direction (North) Backward direction (South) Side View
sNN= 200 GeV d+Au Collision PHENIX central spectrometer magnet Muon Piston Calorimeter (MPC) d Au Forward direction (North) Backward direction (South) Side View
Forward Di-jet Signal with htrig, hassoc = 3.4 Mostly Merged p0s PHENIX central spectrometer magnet Muon Piston Calorimeter (MPC) p0 xgluon ~ 10-3 Nuclear enhancement Au effective xgluon ~ 10-4 clusters Forward direction (North) Backward direction (South) Side View
Forward/Forward Correlations: p+p Trigger particle pT > 2 GeV/c Associate particle pT > 0.875 GeV/c Data points mirrored for Df > p Systematic errors: subtract contributions to angular correlations from invariant mass background underneath p0 peak (see red curve on right) • Show per-trigger correlation functions, i.e. 1/NtrigdN/d(Df) • Area of away-side peak represents conditional yield without efficiency correction • More work needed to determine uncorrelated background level • Conditional yields, widths not shown trigclusterh = 3.4 assoc p0, h = 3.4
p+p vs d+Au MinBias Trigger particle pT > 2 GeV/c Associate particle pT > 0.875 GeV/c Data qualitatively indicates angular decorrelation of d+Au compared to p+p
p+p vs d+Au MinBias (a closer look) Shift minimum y-values to 0 (for comparison only) Data qualitatively indicates angular decorrelation of d+Au compared to p+p It also appears that there is a suppressed conditional yield in d+Au vs. p+p
p+p vs d+Au Central Decorrelation and/or suppression seem to get stronger for central d+Au collisions Beam view of d+Au central collision
p+p vs d+Au Peripheral Peripheral d+Au collisions are more similar to p+p collisions Beam view of d+Au peripheral collision
Comparison to STAR Data d+Au min bias d+Au central p+p p+p p+p d+Au min bias d+Au central
pT Dependence • Next, we show the pT dependence of the correlation functions • pT,trig > 1.0 GeV/c pT,trig > 2.0 GeV/c • pT,assoc > 0.5 GeV/c pT,assoc > 1.0 GeV/c (upper limit due to merging effects is set at 2 GeV/c, but varies with rapidity) • The plots shown have the minimum y-points shifted to 0
d+Au Peripheral, p+p Correlation Functions pT,trig 1.0 GeV/c 2.0 GeV/c 0.5 GeV/c p+p and d+Au peripheral are very similar pT,assoc Beam view of d+Au periph. collision 1.0 GeV/c
d+Au MinBias, p+p Correlation Functions pT,trig 1.0 GeV/c 2.0 GeV/c 0.5 GeV/c d+Au minbias shows signs of suppression pT,assoc 1.0 GeV/c
d+Au Central, p+p Correlation Functions pT,trig 1.0 GeV/c 2.0 GeV/c 0.5 GeV/c d+Au central appears to show disappearance of away-side peak pT,assoc Beam view of d+Au central collision 1.0 GeV/c
Summary & Outlook • Summary of Measurements • Rapidity separated forward/central correlations (Dh = 3.4; trigger particle is at central rapidities) • No significant broadening between d+Au vs pp within experimental precision • Suppression of IdA is observed as one goes to more central collisions, indicating di-jet suppression • Forward/forward correlations (htrig,assoc = 3.1-3.8) • Data seems qualitatively consistent with gluon saturation hypothesis that the d+Au yields are suppressed relative to p+p • Some of the data also suggest that the widths in d+Au are broadened • Need more work on uncorrelated background before making quantitative statements • Future Plans • Determine background, widths, and yields in forward/forward correlations • Apply acceptance x efficiency correction
d+Au Peripheral, p+p Correlation Functions pT,trig 1.0 GeV/c 2.0 GeV/c 0.5 GeV/c pT,assoc Beam view of d+Au periph. collision 1.0 GeV/c
d+Au MinBias, p+p Correlation Functions pT,trig 1.0 GeV/c 2.0 GeV/c 0.5 GeV/c pT,assoc 1.0 GeV/c
d+Au Central, p+p Correlation Functions pT,trig 1.0 GeV/c 2.0 GeV/c 0.5 GeV/c pT,assoc Beam view of d+Au central collision 1.0 GeV/c
IdA vs JdA: Can we decouple effects? • IdA is the per trigger comparison of d+Au jet associated counts relative to p+p • JdA is the rate of the associated pairs from a jet (per minbias event) • Can we use this to tell if the jets are modified, or do they disappear? • From the CNT-MPC corrrelations, we get IdA ~ 0.5, and RdA ~ 1.1 • JdA ~ 0.5 • The rate of correlated pairs is about half of p+p • Does this imply that the missing jets have disappeared, and not that they are modified, since IdA ~ JdA? • But not true for STAR FMS triggered-central barrel, where IdA ~ 1 and JdA ~ 0.5
MPC Invariant Mass Peaks d+Au 0-20 d+Au 60-88 p+p 9 GeV < E < 17 GeV pT > 0.75 GeV/c
Experimental Method: Overview • Using azimuthal angle (transverse direction) two-particle correlations • d+Au (Lint=80 nb-1), pp (Lint=5.2 pb-1) collisions at sNN= 200 GeV from RHIC Run8 • Trigger particles are (p0, h+/-) with |h| < 0.35 • Associate particles are forwardp0s and clusters with 3.1 < h < 3.9 • Probes gluon distribution at moderately low x • Signal of saturation is suppression/broadening of away-side peak in d+Au relative to p+p Example Correlation Function for rapidity separated particles Central Rapidity Spectrometer Forward EMC π0 π0 3.1 < η < 3.9 x-range in Au: 0.006 < x < 0.1 Df From calculation by Marco Stratmann
Correlation Functions for central arm/MPC Central Rapidity Spectrometer Forward MPC π0 π0 3.1 < η < 3.9
p0 (trigger,central)/p0 (associate,forward) <pTa>=0.55 GeV/c <pTa>=0.77 GeV/c <pTa>=1.00 GeV/c 2.0 < pTt < 3.0 GeV/c for all plots pp Correlation Function dAu 0-20% dAu 60-88% pTt, p0 Df pTa, p0
p0 (trigger,central)/p0 (associate,forward) <pTa>=0.55 GeV/c <pTa>=0.77 GeV/c <pTa>=1.00 GeV/c 3.0 < pTt < 5.0 GeV/c for all plots pp Correlation Function dAu 0-20% dAu 60-88% pTt, p0 Df pTa, p0
h+/- (trigger,central)/p0 (associate,forward) <pTa>=0.55 GeV/c <pTa>=0.77 GeV/c <pTa>=1.00 GeV/c 1.0 < pTt < 2.0 GeV/c for all plots pp Correlation Function dAu 0-20% dAu 60-88% pTt, h+/- Df pTa, p0
p0 (trigger,central)/cluster (associate,forward) <pTa>=1.09 GeV/c <pTa>=2.00 GeV/c <pTa>=3.10 GeV/c 2.0 < pTt < 3.0 GeV/c for all plots pp Correlation Function dAu 0-20% dAu 60-88% pTt, p0 Df pTa, cluster