Download
1 / 25
250 likes | 520 Views
National Immunization Survey: Data Quality and Public-Use Data Files. Meena Khare, National Center for Health Statistics Michael P. Battaglia, Abt Associates Inc. July 16, 2002. Outline. National Immunization Survey Quality of the data Confidentiality issues

E N D
National Immunization Survey: Data Quality and Public-Use Data Files Meena Khare, National Center for Health Statistics Michael P. Battaglia, Abt Associates Inc. July 16, 2002
Outline • National Immunization Survey • Quality of the data • Confidentiality issues • Public Use Data Files (PUF) • Summary 2
National Immunization Survey (NIS) • Large ongoing RDD survey, conducted by CDC since 1994 • Measures vaccination coverage among children aged 19-35 months at National, State, and Urban area levels (78 IAP areas) • Monitors Healthy People 2000 and 2010 goals of immunization coverage • >90% Coverage: 4DTP, 3Polio, 1MMR, 3HepB, 3Hib, and 4:3:1:3 series • Monitors introduction of new vaccines • <4% of households in the U.S. contain child of age 19-35 months 3
NIS Data Collection • Household CATI Screener and Interview • Parent/Guardian (most knowledgeable person) • Socio-demographic information: mother and child • Shot card use or memory recall • Vaccination dates (shot card only) • Provider’s contact information with consent • Provider Record Check Study (mailed IHQ) • Provider’s office (e.g., staff, nurse, manager) • Mail, Fax, Telephone • Completed IHQ or copy of medical records • Matched on DOB, Gender, Name • Vaccination history • Provider’s information 5
Goals of Quality Control in the NIS • Evaluate and improve quality of the information collected • Reduce/eliminate discrepancies • Improve quality of the estimates • Reduce potential bias in official estimates of vaccination coverage rates 7
Quality Control Procedures used in the NIS • Extensive monitoring and QC review of the data collected from CATI and mailed IHQs • Automated edit software for processing combined household and provider data • Manual ‘Matching Sheet’ review of discrepant cases • Resolution by using guidelines developed by expert immunization program managers 8
Review of Data Errors in the IHQ • Data Entry Validation • Double data entry • Approximately 400 forms reviewed/quarter • Error rates ranged from 0.23% - 0.67% (~30,000 fields with data, NIS Q4/1999-Q4/2001) • ~350-1000 manual Matching Sheet reviews/quarter for discrepant data • Most errors in dates are found in the original provider-reported records • <1% children had data errors 9
Observed Discrepancies in Dates • DOB • Between household (HH) and provider(s) • Between multiple providers for a child • Shot dates • Between HH and provider(s) • Within a single provider • Between multiple providers for a child 10
Matching Sheet Review, 2000 NIS • DOB and Shot dates • 122 children classified as age-ineligible • 69 IHQs filled out for the ‘wrong’ child • 21 children had changes in best DOB • 2163 children had shot dates before DOB or vaccination interval < 1 month, or other shot date edits • Hepatitis B ‘birth’ dose • 361 children had missing provider ‘birth dose' of Hepatitis B and providers had checked the ‘given at birth’ box on IHQ • 34 children had imputed dates from the household shot card • 327 children had imputed dates from the distribution of provider-reported dates for the birth dose 11
Results of Quality Control Evaluation • No single data source is 100% complete and accurate • Some discrepancies in DOB and vaccination dates/number of doses could not be verified and remained after edits • Number of discrepancies increased if more than one immunization provider per child (1.35 providers per child in 1999 NIS ) was identified • Errors in • Original Immunization records • Locating records for the correct child • Transcribing shot dates to the IHQ • Illegible dates, transposed dates, missing day/month, incorrect dates (especially year) • Shot date interval< 1 month, or shot dates<DOB • Missing ‘first’ Hepatitis B dose given at birth 12
‘Best’ Vaccination Value Research • Currently, coverage estimates from the provider data are used as official estimates • The goal of ‘best’ value research is to obtain the most complete and accurate immunization data possible from two sources • Supplement incomplete provider data with household data for children who are UTD from ‘shot card’ • Substitute completely missing provider data with household data for children who are 4:3:1:3 UTD from ‘shot card’ 13
NIS 2000 Sample • 35,960 households with eligible children 19-35 months • 33,477 (93.1%)of eligible households with completed interviews • 34,087 age-eligible children with completed interviews • 22,958 (67.4%) children with completed interviews and ‘adequate’ provider data 14
Sources of Immunization Histories, 2000 NIS * row percents 15
Assessment of Provider-Reported 4:3:1:3* Coverage Estimates among Children with Household Data,2000 NIS *4DTP/3Polio/1MCV/3Hib ** Other 5,469 non-shot card children have missing 4:3:1:3 UTD status 16
Comparison of Vaccine-specific Coverage Rates by Source of Immunization Histories, 2000 NIS Best Value: Combined Provider and household ‘shot card’ data Revised Best Value: After adjusting Best Value for missing provider data among non-shot card children 17
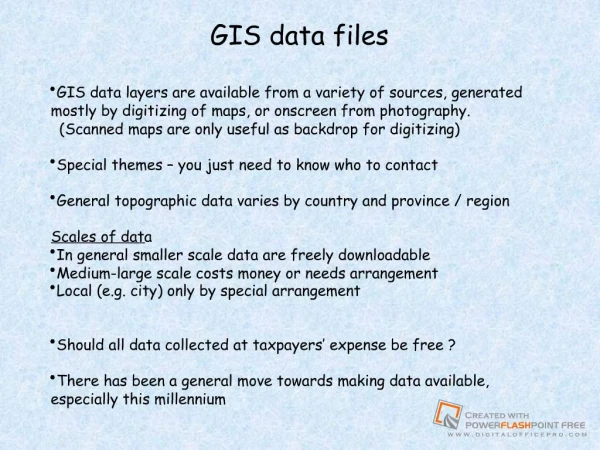
NIS Data Files and Estimates • In-house analytic files • Public-use data files (PUF ) • National, State, and Urban area level estimates of vaccination coverage • Internet: www.cdc.gov/nip/coverage • MMWR • Journal Articles • Articles in Proceedings • Presentations at National and State Conferences • Publications are listed on NIS Web site 18
Confidentiality Issues • Legal obligation to protect confidentiality of respondents and reduce risk of disclosure • Sample size (4 quarters) • ~ 440 children per IAP with interview data • ~ 290 children per IAP with provider data • Only telephone households (90% HHs with telephone) • Rare population (children 19-35 months) • Geographic identifiers • State, Urban Areas • Census Region • Smaller geographic areas (e.g., Zip code, county) • Socio-demographic details • Analytic cells and cell sizes (within IAP area) • Age, gender, race/ethnicity • WIC participation, Poverty status • Minimum population size>5 in unique cells • Date of birth, shot dates, interview dates • Clearance by the NCHS Disclosure Review Board (DRB) 19
The NIS PUF • Public-use data files (1995-2000): Child-level records with 78 IAP area (state and urban) identifiers (2001 NIS PUF by Fall 2002) • Approximately 35,000 age-eligible children with household interview data • Approximately 23,000 children with household interview and ‘adequate’ provider data; on average 295 children per IAP area • PUFs released on the Internet and CD-ROMs • Internet : www.cdc.gov/nis (1995-2000) • CD_ROMs No 1-5 20
Contents of The NIS PUF • Household Interview data items • Unique sequence ID, age at interview (months), gender, race/ethnicity, … • Mother’s age group, education, marital status, … • WIC participation, income, poverty status,… • Vaccine specific immunization history (#doses, up-to-date status) • IAP area and State identifiers, Census Region • Provider data items • Vaccine-specific Immunization History: age at vaccination(days/months), number of doses, up-to-date status (UTD) • Providers’ information (e.g., facility type, VFC participation) 21
Contents of NIS PUF (cont.) • Composite vaccine-specific and vaccine series flags with up-to-date status • Sampling weights and key analytic variables • Sampling weights: Children with household interview (HY_WGT) Children with Provider data(W0) • Stratum + PSU identification variables 22
Summary • Complicated Childhood Immunization Schedule • No single source is 100% complete or accurate • <1% children were observed with discrepancies in household and/or provider reported data • Data reported from written ‘shot card’ are of high quality; Shot card use varies by State/IAP area • High vaccine-specific agreement in the UTD status between HH ‘shot card’ and provider report(s) when HH reported UTD 23
Summary • Substantial underreporting in vaccination coverage rates from the household reports • Strongly supports the use of provider-reported immunization histories in computing vaccination coverage estimates • Official estimates from provider reports may slightly underestimate coverage rates due to missing provider data; however, provider data produce comparable estimates across IAP areas 24
Visit the Web Sites • For information on the NIS PUF and coverage estimates • http://www.cdc.gov/nis • http://www.cdc.gov/nip/coverage