Download
1 / 33
340 likes | 522 Views
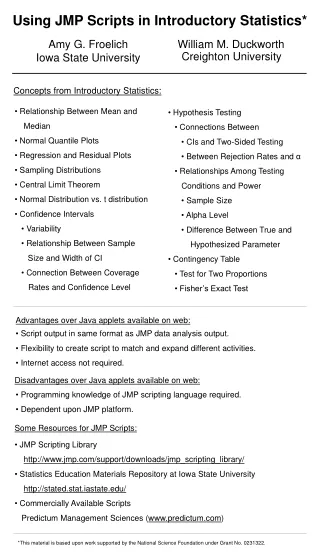
Models and Modeling in Introductory Statistics. Robin H. Lock Burry Professor of Statistics St. Lawrence University 2012 Joint Statistics Meetings San Diego, August 2012. What is a Model?. What is a Model?.

E N D
Models and Modeling in Introductory Statistics Robin H. Lock Burry Professor of Statistics St. Lawrence University 2012 Joint Statistics Meetings San Diego, August 2012
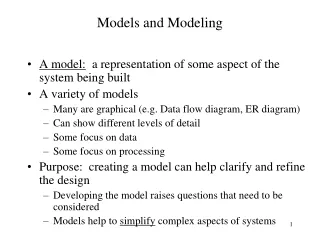
What is a Model? A simplified abstraction that approximates important features of a more complicated system
Traditional Statistical Models YN(μ,σ) Population Often depends on non-trivial mathematical ideas.
Traditional Statistical Models Relationship Response (Y) Predictor (X)
“Empirical” Statistical Models A representative sample looks like a mini-version of the population. Model a population with many copies of the sample. Bootstrap Sample with replacement from an original sample to study the behavior of a statistic.
“Empirical” Statistical Models Hypothesis testing: Assess the behavior of a sample statistic, when the population meets a specific criterion. Create a Null Model in order to sample from a population that satisfies H0 Randomization
Traditional vs. Empirical • Both types of model are important, BUT • Empirical models (bootstrap/randomization) are • More accessible at early stages of a course • More closely tied to underlying statistical concepts • Less dependent on abstract mathematics
Example: Mustang Prices Data: Sample prices for n=25 Mustangs Estimate the average price of used Mustangs and provide an interval to reflect the accuracy of the estimate.
Original Sample Bootstrap Sample
BootstrapSample Bootstrap Statistic BootstrapSample Bootstrap Statistic Original Sample Bootstrap Distribution . . . . . . Sample Statistic BootstrapSample Bootstrap Statistic
Background? What do students need to know about before doing a bootstrap interval? • Random sampling • Sample statistics (mean, std. dev., %-tile) • Display a distribution (dotplot) • Parameter vs. statistic
Traditional Sampling Distribution Population BUT, in practice we don’t see the “tree” or all of the “seeds” – we only have ONE seed µ
Bootstrap Distribution What can we do with just one seed? Bootstrap “Population” Estimate the distribution and variability (SE) of ’s from the bootstraps Grow a NEW tree! µ
Course Order • Data production • Data description (numeric/graphs) • Interval estimates (bootstrap model) • Randomization tests (null model) • Traditional inference for means and proportions (normal/t model) • Higher order inference (chi-square, ANOVA, linear regression model)
Traditional models need mathematics, Empirical models needtechnology!
Some technology options: • R (especially with Mosaic) • Fathom/Tinkerplots • StatCrunch • JMP StatKey www.lock5stat.com
Built-in data Enter new data One to Many Samples Three Distributions
Distribution Summary Stats Interact with tails
Smiles and Leniency Does smiling affect leniency in a college disciplinary hearing? 4.12 4.91 Null Model: Expression has no affect on leniency LeFrance, M., and Hecht, M. A., “Why Smiles Generate Leniency,” Personality and Social Psychology Bulletin, 1995; 21:
Smiles and Leniency Null Model: Expression has no affect on leniency • To generate samples under this null model: • Randomly re-assign the smile/neutral labels to the 68 data leniency scores (34 each). • Compute the difference in mean leniency between the two groups, • Repeat many times • See if the original difference, , is unusual in the randomization distribution.
StatKey p-value = 0.023
Traditional t-test H0:μs = μn H0:μs> μn
Assessment? Construct a bootstrap distribution of sample means for the SPChange variable. The result should be relatively bell-shaped as in the graph below. Put a scale (show at least five values) on the horizontal axis of this graph to roughly indicate the scale that you see for the bootstrap means. Estimate SE? Find CI from SE? Find CI from percentiles?
Assessment? From 2009 AP Stat: Given summary stats, test skewness Ratio=1.04 for the original sample Given 100 such ratios for samples drawn from a symmetric distribution Find and interpret a p-value
Implementation Issues • Good technology is critical • Missed having “experienced” student support the first couple of semesters
Why Did I Get Involved with Teaching Bootstrap/Randomization Models? It’s all George’s fault... "Introductory Statistics: A Saber Tooth Curriculum?" Banquet address at the first (2005) USCOTS George Cobb
Models in Introductory Statistics Introduce inference with “empirical models” based on simulations from the sample data (bootstraps/randomizations), then approximate with models based on traditional distributions.