Download
1 / 47
580 likes | 988 Views
Fluid Processes in Subduction Zones Hydrous Minerals and Dehydration Reactions. Simon M. Peacock Dept. of Earth and Ocean Sciences University of British Columbia. Effects of H 2 O on Subduction Zones.

E N D
Fluid Processes in Subduction Zones Hydrous Minerals and Dehydration Reactions Simon M. Peacock Dept. of Earth and Ocean Sciences University of British Columbia
Effects of H2O on Subduction Zones • H2O and hydrous minerals weaken plate interface permitting subduction and plate tectonics to occur • H2O lowers melting temperature of mantle, generates explosive arc magmas • Fluids released by slab dehydration promote brittle behavior and may trigger earthquakes • Hydration structure, rheological structure, and thermal structure of subduction zones are strongly coupled
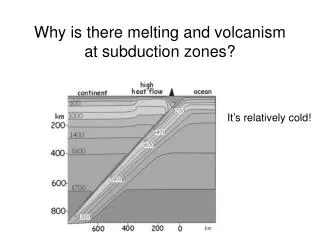
Selected Characteristics of Volcanic Arcs • Depth to underlying Benioff zone is ~100 – 200 km • Depth to underlying Benioff zone beneath volcanic front is 124± 38 km (Gill, 1981) • suggestive of P-dependent melting or slab dehydration rxn • or may be necessary depth for slab in order to be overlain by hot asthenosphere such that addition of H2O triggers melting • Several places where active arc is missing (or feeble) • Peru, central Chile, SW Japan • T eruptions – 1050-1100°C • T mantle equil – commonly 1300°C+ for basalts
Geochemistry of Arc Magmas Compared to MORBs, arc magmas are: • Fractionated • basalts andesites dacites rhyolites • Wet • Enriched in many trace elements, such as Rb, that appear to be derived from the subducting slab
H2O Content of Arc Magmas • Significantly more H2O than MORBs, OIBs • Explosive eruptions (more H2O degassing, higher SiO2 content) • Hornblende (amphibole) is common phenocryst • H2O dramatically lowers melting T of rocks, mantle by 100s of degrees. key to arc magma genesis
H2O measurements of volcanic glasses • For submarine basaltic glasses, we can measure H2O contents directly because ocean pressure prevents H2O from exsolving. • For subaerially erupted glasses, measure glass inclusions. • MORB glasses < 0.5 wt % H2O • Back-arc basin glasses • 0 – 2.5 wt % (ave = 1.1 wt %) H2O • Arc glass inclusions • 0 – 6 wt % (ave = 3.4 wt%) H2O Stern (2002)
Arc MagmasDistinctive Trace Element Characteristics • Arc basalts, as compared to MORBs, are • Enriched in large-ion lithophile elements (LILE) K, Rb, Cs, Sr, Ba, and Pb, U, B, Be • Depleted in high field strength elements (HFSE) Y, Zr, Hf, HREE, Nb, Ta (controversial niobium anomaly: Ti-phase in source?, prev. melting event?) • H2O-rich fluids will preferentially contain more mobile LILE – derived from slab • Be and Th are relatively enriched in arc basalts, but believed to be relatively insoluble in H2O-rich fluids suggests sediment melting
Variably hydrated oceanic crust and mantle Zandt (2002)
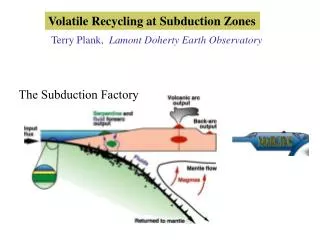
Hydration of Oceanic Crust & Mantle Hydrothermal circulation at mid-ocean ridges • Black smokers • Adds H2O, CO2 to crust • Basalt, gabbro hi T, lo P minerals (amph, chl, epi) • Believed to be limited to oceanic crust, but could go deeper at slow-spreading ridges • Sea-floor weathering • Low T alteration Likely additional hydration at trench - outer-rise, including serpentinization of uppermost mantle
Global Subduction H2O Fluxes Input fluxes: [1012 kg/yr] Pore H2O Sediments 1Expelled by Oceanic crust 0.1 porosity collapse Chemically bound H2O Sediments 0.1 Expelled by Oceanic crust 1 to 2metamorphic Oceanic mantle 0.1 to 1dehydration rxns Output flux to arc magmas: 0.1 to 0.4 (5-20% of input flux) Mass of hydrosphere = 1.4 x 10²¹ kg
• Oceanic crust: basalts = 1-3 wt % H2O gabbros = 0.5-1 wt % H2O • High-pressure metabasalts contain more bound H2O than altered basalts recovered in DSDP/ODP drill core. Peacock (2004)
Porosity collapse: Sediment compaction Basalts ~ 200-400 °C Slab dehydration reactions Temperature-dependent Thermal structure of a subduction zone determines where H2O is released from slab and where hydrous minerals may be stable in the overlying plate. Hyndman and Peacock (1999)
Thermal structure of subduction zones • Subducting slab drags down isotherms • Inverted isotherms beneath mantle wedge • Mantle-wedge isotherms parallel to flow lines • Tinterface~ 0.5 Tmantle
Cool vs. Warm Subduction Zones after Peacock and Wang (1999)
In warm subduction zones, H2O is liberated from the slab by metamorphic dehydration reactions and possibly by the collapse of porosity in the upper crust. The amount of H2Oreleased is predicted to be small: 0.1 x 10⁻³ m3 / (m2 yr) = 100 milliliters of H2O per m2 column per year Hyndman and Peacock (1999)
Metamorphic facies – diagnostic mineral assemblage indicative of region in P-T space (particularly used in mafic systems) Facies boundaries – complex reactions
Dehydration of subducting oceanic crust eclogite blueschist • Metabasalt dehydration reactions are generally continuous reactions, which are smeared out in P-T space • Metabasalt eclogite rxns release large amounts of H2O, increase density, and increase seismic velocity
Crust subducted in warm subduction zones passes through greenschist epidote bluseschist/greenschist eclogite facies. And transformation of metabasalt to eclogite (garnet + cpx) occurs at ~50 km. Thermal models: Peacock and Wang (1999) Currie et al. (2000) Peacock et al. (2002)
Cascadia (central Oregon) • Serpentinized forearc mantle • Metabasalt --> eclogite Bostock et al. (2002)
For a given P, T, and composition (X), what is the mineralogy of the rock? • P = r g z • T = thermal models • X = bulk composition, including H2O content - fully hydrated or anhydrous?
Phase diagram for SiO2 qtz = coes DGrxn = 0 dP/dT = DS/DV Clapeyron slope Higher pressure higher r Higher temperature higher S coesite ~2.5 GPa P quartz T
Dehydration Reactions dP/dT = DS/DV = + / - = negative because H2O is compressible P olivine + orthopyroxene + H2O serpentine dP/dT = DS/DV = + / + = positive T
Dehydration rxns: In nature, many reactions are “smeared out” in P-T space because of: • Solid solutions – particularly in mafic rocks (e.g., Fe-Mg) • Variable fluid compositions • Kinetics
Dehydration rxns (cont.): Phase diagrams can be based on : • Experiments (sluggish at T < 600°C) • Thermodynamic calculations (must know all phases, solid solutions) • Field-based petrologic studies (observations + P-T-ometry) • Combinations of all 3
Experimentally determined phase relations in H2O saturated MORB Schmidt + Poli (1998)
Maximum H2O contents bound in hydrous minerals in MORB Schmidt + Poli (1998)
Schmidt + Poli (1998) Phase diagram for H2O-saturated peridotite and maximum H2O content
Important points of Schmidt & Poli (1998) • Numerous hydrous minerals stable in subduction zones. Amphibole is not the key • Dehydration of slab is ~continuous due to smeared out P-T rxns + isotherm / isobaric structure • Volcanic front controlled by wedge isotherm (not a specific dehydration rxn) • Serpentine phase A may transport H2O to great depth in cool s.z. • Distribution + amount of H2O incoming lithosphere is critical unknown
Phase Diagram for Metabasalt Based on field observations and thermo calculations Facies boundaries are broader than depicted Different parts of subducted crust intersect facies boundaries at different places P Hacker et al. (2003) T
Hacker et al. (2003)
Hacker et al. (2003, JGR)
Hacker et al. (2003, JGR)
Hacker et al. (2003, JGR)
Where does H2O expelled from the subducting slab go? Updip fluid flow along faults to seafloor/surface Incorporated into forearc crust (hydration) Incorporated into forearc mantle (hydration) Incorporated into arc magmas Subducted past volcanic arc
Example of retrograde metamorphic reaction: Serpentinization of the forearc mantle wedge Mg2SiO4 + MgSiO3 + 2H2O = Mg3Si2O5(OH)4 olivine pyroxene fluid serpentine (13 wt% H2O) Serpentine mud volcanoes in Mariana forearc (Fryer et al.)
Evidence for Serpentinized Forearc Mantle • Active serpentine mud volcanoes (Mariana forearc) • Hydrated ultramafic hanging walls of paleosubduction zones • Low seismic velocities, high Poisson’s ratios observed in forearc mantle (Alaska, Aleutians, Andes, Cascadia, Costa Rica, Izu-Bonin, Japan, Mariana)
Consequences of serpentinized forearc mantle Zandt (2002) • “Weak” serpentinite may control downdip limit of seismogenic zone and reduce mechanical coupling b/w slab and wedge • Buoyancy will tend to isolate forearc wedge from corner flow • Heating of hydrated forearc mantle (e.g., ridge subduction, post-subduction) will release significant amounts of H2O
Cascadia (central Oregon) Bostock et al. (2002, Nature)
Isoviscous vs. Olivine Rheology van Keken, Kiefer, and Peacock (2002)
Mantle Wedge and Interface Rheology Non-Newtonian Cold nose (0% coupling) Isoviscous wedge Non-Newtonian Cold nose (10% coupling) Non-Newtonian wedge Abers et al. (2006)