Download
1 / 1
10 likes | 137 Views
Visualizing Forecast Uncertainty For a Non-expert Web Audience Sonia Savelli & Susan Joslyn University of Washington Seattle, Washington, USA. Probcast Website. Results.

E N D
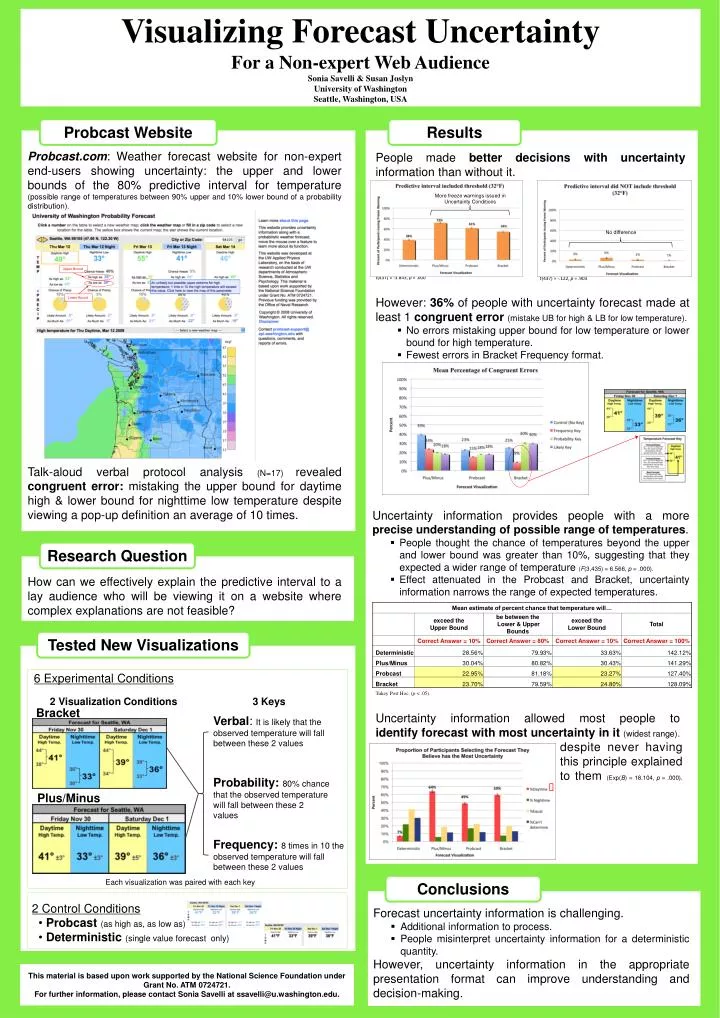
Visualizing Forecast Uncertainty For a Non-expert Web Audience Sonia Savelli & Susan Joslyn University of Washington Seattle, Washington, USA Probcast Website Results Probcast.com: Weather forecast website for non-expert end-users showing uncertainty: the upper and lower bounds of the 80% predictive interval for temperature (possible range of temperatures between 90% upper and 10% lower bound of a probability distribution). People made better decisions with uncertainty information than without it. More freeze warnings issued in Uncertainty Conditions No difference Upper Bound t(437) = -3.843, p= .000 t(437) = -.122, p = .903 • However: 36% of people with uncertainty forecast made at least 1 congruent error (mistake UB for high & LB for low temperature). • No errors mistaking upper bound for low temperature or lower bound for high temperature. • Fewest errors in Bracket Frequency format. Lower Bound Talk-aloud verbal protocol analysis (N=17) revealed congruent error: mistaking the upper bound for daytime high & lower bound for nighttime low temperature despite viewing a pop-up definition an average of 10 times. • Uncertainty information provides people with a moreprecise understanding of possible range of temperatures. • People thought the chance of temperatures beyond the upper and lower bound was greater than 10%, suggesting that they expected a wider range of temperature (F(3,435) = 6.566, p= .000). • Effect attenuated in the Probcast and Bracket, uncertainty information narrows the range of expected temperatures. Research Question How can we effectively explain the predictive interval to a lay audience who will be viewing it on a website where complex explanations are not feasible? Tested New Visualizations 6 Experimental Conditions Tukey Post Hoc: (p< .05). 2 Visualization Conditions 3 Keys Bracket Uncertaintyinformation allowed most people toidentify forecast with most uncertainty in it (widest range). Verbal: It is likely that the observed temperature will fall between these 2 values despite never having this principle explained to them (Exp(B) = 18.104, p= .000). Probability:80% chance that the observed temperature will fall between these 2 values ✔ Plus/Minus Frequency:8 times in 10 the observed temperature will fall between these 2 values Each visualization was paired with each key Conclusions 2 Control Conditions • Probcast(as high as, as low as) • Deterministic(single value forecast only) • Forecast uncertainty information is challenging. • Additional information to process. • People misinterpret uncertainty information for a deterministic quantity. • However, uncertainty information in the appropriate presentation format can improve understanding and decision-making. This material is based upon work supported by the National Science Foundation under Grant No. ATM 0724721. For further information, please contact Sonia Savelli at ssavelli@u.washington.edu.