Download
1 / 31
320 likes | 571 Views
Consumer Preferences for Farm Animal Welfare. Results from a Telephone Survey of U.S. Households. Rob Prickett M.S. Candidate Agricultural Economics Oklahoma State University. Introduction. Advances in animal agriculture Feed and other technological advances Animal rights movement

E N D
Consumer Preferences for Farm Animal Welfare Results from a Telephone Survey of U.S. Households Rob Prickett M.S. Candidate Agricultural Economics Oklahoma State University
Introduction • Advances in animal agriculture • Feed and other technological advances • Animal rights movement • HSUS, PETA and policy • Shifts in consumer preferences • Signs of concern for animals • Food industry reactions
Objectives • Determine consumer attitudes toward farm animal welfare and how attitudes vary by demographic characteristics. • Determine the relative desirability of alternative animal production practices. • Assist humane meat producers to better understand their consumer’s preferences.
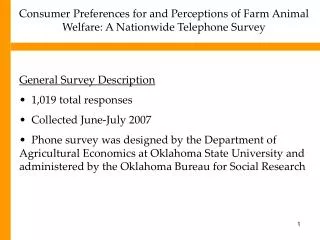
Methodology • Survey of Consumer Preferences • Telephone survey conducted in July 2007 with 1,019 responses • 16% response rate with a ±3% sampling error at 95% confidence level
Methodology: Objective 1 • Survey Questions: • I consider the well-being of farm animals when I make decisions about purchasing meat. • Low meat prices are more important than the well-being of farm animals • The government should take an active role in promoting farm animal welfare. • Responses: • 0: Strongly Disagree • 1: Somewhat Disagree • 2: Neither • 3: Somewhat Agree • 4: Strongly Agree
Methodology: Ordered Logit Model • Ordered Logit Model • The mapping of the latent attitude into statements of agreement follow the following process: Where, y*= unobserved response, X= a vector of demographics, β= parameter to be estimated, and ε is a Type I Extreme Value error term. y = 0 if y*≤ 0, strongly disagree = 1 if 0 < y* ≤ µ1, disagree = 2 if µ1 < y* ≤ µ2, neither agree nor disagree = 3 if µ2 < y* ≤ µ3, agree = 4 if µ3 ≤ y*, strongly agree
Methodology: Ordered Logit Model • The probability of a respondent answering in any of the five categories, where Φis the logistic distribution is: • The βi’s and μi’s are chosen to maximize the following: Prob(y=0)=Φ(-β' x) Prob(y=1)=Φ(μ1-β' x)-Φ(-β' x) Prob(y=2)=Φ(μ2-β' x)-Φ(μ1-β' x) Prob(y=3)=Φ(μ3-β' x)-Φ(μ2-β' x) Prob(y=4)=1-Φ(μ4-β' x) Where, i = a respondent, j =one possible response, and I[y = j] = indicator function
Methodology: Objective 2 • Pairwise Comparison Questions • “Is it more important that farm animals be provided shelter at a comfortable temperature or be allowed to exercise outdoors?” • receiving treatment for injury and disease • being allowed to exhibit natural behaviors • receiving ample food and water • provided shelter at a comfortable temperature • provided comfortable bedding • allowed to exercise outdoors • protected from being harmed by other animals • allowed to socialize with other animals • raised in a way to keep prices low
Methodology: Conditional Logit • Conditional Logit Model • The importance any one individual places on each attribute is: U=Perceived importance of practice βi= constant common parameter e=stochastic term that accounts for error Receiving treatment for injury and disease: Ua = βa + ea Being allowed to exhibit normal behaviors: Ub = βb + eb Receiving ample food and water: Uc = βc + c Provided shelter at a comfortable temperature: Ud = βd + ed Provided comfortable bedding: Ue = βe + ee Allowed to exercise outdoors: Uf = βf + ef Protected from being harmed by other animals: Ug = βg + eg Allowed to socialize with other animals: Uh = βh + eh Raised in a way to keep prices low: Ui = βi + ei
Methodology: Conditional Logit • The probability that Ui > Uj is based on: βi + ei > βj + ej • This leads to βi - βj > ei – ej ,which given the distribution e= • Given this probability the βi’s are chosen to maximize the following function: • Where, Y=1 or 0, i=an individual, q=a pairwise comparison
Methodology: Importance Score • What do the coefficients mean? • A more intuitive explanation:
Methodology: Latent Class Model • Model splits respondents into distinct “classes” with distinct β’s • To determine optimal amount of classes pick LCM with the lowest BIC. • Demographics • Model generates respondents probabilities of belong to each class • Determines demographics of each class
Results: Overall Concern 1,011 Responses
Results: Overall Concern 1,004 Responses
Results: Overall Concern 1,005 Responses
Tabulated Results • Females are more concerned with farm animal welfare than males • Residents from the Northeast show more concern and favor government regulation. • Republicans are strongly against regulation and are less likely to consider animal welfare in buying decisions. • Large income and highly educated people are less likely consider animal welfare. • Age and population density are not a factor in animal welfare.
Results: Ordered Logit for Demographics • Q1: I consider the well-being of farm animals when I make decisions • about purchasing meat. ** Statistically significant at the 5% level
Results: Ordered Logit for Demographics • Q2: Low meat prices are more important than the well-being of farm animals ** Statistically significant at the 5% level
Results: Ordered Logit for Demographics • Q3: The government should take an active role in promoting farm animal welfare. ** Statistically significant at the 5% level
Results: Conditional Logit Model ** Statistically significant at the 5% level
Results: Latent Class Models • Class 1: Naturalists- 46% Probability of Class Membership ** Statistically significant at the 5% level
Results: Latent Class Models • Class 2: Price Seekers- 14% Probability of Class Membership ** Statistically significant at the 5% level
Results: Latent Class Models • Class 3: Descartes’ Entourage- 40% Probability of Class Membership ** Statistically significant at the 5% level
Conclusions • Overall survey indicates: • General concern for farm animal welfare • Animal welfare is more important than price • Most favor more government intervention
Conclusions • Demographically: • Females, Democrats and residents from the Northeast favor farm animal welfare. • These along with residents from highly populated areas favor government regulation • Republicans are less concerned with animal welfare and oppose any government action • Residents from the Midwest are more willing to sacrifice animal welfare for low prices. • High income households are not concerned with animal welfare and generally oppose government regulation.
Conclusions • Importance of Production Practices • Basic Needs • Natural Behavior = Outdoor Exercise • Protection from other animals • Shelter • Socializing with other animals • Low food prices=Comfortable bedding
Conclusions: Latent Classes • The Naturalists • Focus on normal Behavior • Largest class • Descartes’ Entourage • Basic Needs • Second highest class • Price Seekers • Sole emphasis on price • Males, Republicans and high income households
Further Research • Uninformed respondents • Mainly policy implications • Social Desirability and Hypothetical Bias • Actual behavior unknown • Willingness-to-pay studies, with non-hypothetical choice experiments or auctions • Ambiguity of questions • What does “active role” by the government mean?
Thanks For Coming! Questions?
Bayesian Information Criterion The BIC is calculated from different models with various numbers of classes, the model that reports the lowest BIC contains the optimal number of classes.
Hypothesis Tests • Tests if coefficients are statistically different • Ho: βi = βj • HA: βi ≠ βj • The t-stat of the covariance between similar coefficients is calculated. • If |t-stat| ≥ 2 then reject Ho and conclude HA. If |t-stat| < 2 then conclude Ho.