Download
1 / 87
900 likes | 1.2k Views
Characterization of Coastal Wetland Systems using Multiple Remote Sensing Data Types and Analytical Techniques . Daniel Civco (PI) James Hurd University of Connecticut Natural Resource Management & Engineering, Storrs, CT. Marty Gilmore (PI) Wesleyan University

E N D
Characterization of Coastal Wetland Systems using Multiple Remote Sensing Data Types and Analytical Techniques • Daniel Civco (PI) • James Hurd • University of Connecticut • Natural Resource Management • & Engineering, Storrs, CT Marty Gilmore (PI) Wesleyan University Earth and Environmental Sciences Middletown, CT Sandy Prisloe Emily Wilson University of Connecticut Cooperative Extension System Haddam, CT
Outline • Salt Marshes 101 • Moderate resolution remote sensing of tidal marshes • Airborne LIDAR and satellite high resolution remote sensing of salt marsh grasses • Classification of tidal wetland communities using multi-temporal, single-season QuickBird imagery
Outline • Salt Marshes 101 • Moderate resolution remote sensing of tidal marshes • Airborne LIDAR and satellite high resolution remote sensing of salt marsh grasses • Classification of tidal wetland communities using multi-temporal, single-season QuickBird imagery
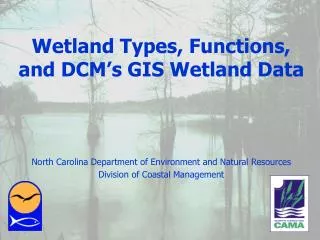
The Value of Marshes • Important transitional habitat between the ocean and the land • estuaries where fresh and salt water mix • Among the most productive ecosystems on earth, rivaling that of an Iowa cornfield • Salt marsh plants (halophytes) are salt tolerant and adapted to water levels that fluctuate with the tide • Tides carry in nutrients that stimulate plant growth in the marsh and carry out organic material that feeds fish and other coastal organisms • Over time, salt marshes accumulate organic material, forming into a dense layer called peat
The Value of Marshes • Position on the landscape and their productivity makes them important not only as a part of the natural world but also to humans • About 15,309 acres of salt marsh in Connecticut, many of which have been damaged by management actions that have had unintentional consequences • Restricted tidal flow • Filling • Ditching • Increased freshwater flows • Due to degradation, restoration is often necessary to improve the following functions that salt marshes provide, such as • Nursery area for fish, crustacea, and insects • Resting area for migratory waterfowl • Protection against waves and sea level rise • Aesthetics
Marsh Morphology Artist: Stephanie Schanda (Lee, NH) Project SMART Student, 1998 http://www.smart.unh.edu/smartfmb98/saltmarsh/saltmarsh1.html
Want more ? TIDAL MARSHES OF LONG ISLAND SOUND ECOLOGY, HISTORY, AND RESTORATION EDITED BY GLENN D. DREYER AND WILLIAM A. NIERING ILLUSTRATIONS BY THOMAS R. OUELLETTE http://www.conncoll.edu/ccrec/greennet/arbo/publications/34/frame.htm
Outline • Salt Marshes 101 • Moderate resolution remote sensing of tidal marshes • Airborne LIDAR and satellite high resolution remote sensing of salt marsh grasses • Classification of tidal wetland communities using multi-temporal, single-season QuickBird imagery
A basic question … Can tidal wetlands, such as those found throughout Long Island Sound (those being of various shapes and relatively small in size, and varying distances from open water) be adequately classified from only a single date Landsat image (and derived products) ?
… approach Integrated Pixel-based and Object-based Classification
Landsat Enhanced Thematic Mapper Stitch line Mosaic Path 13, Row 31 & Path 13, Row 32 Landsat ETM Sept. 8, 2002.
Sept 8, 2002 Landsat ETM Water Index to identify water pixels digitize some smaller creeks 40 pixel buffer from water pixels Extract image pixels Extracting Analysis Area
Analysis Area Landsat ETM, Sept 8, 2002 Connecticut River Thames River Housatonic River New Haven Bridgeport Gardiner’s Bay Long Island Sound New York City
Pixel-based Classification (Unsupervised “Cluster-busting”)
1st pass 150 Clusters: Pixel-based Classification Wheeler Marsh Area, Milford, CT Landsat ETM Sept. 8, 2002 ISODATA Unsupervised Classification 2nd pass 100 3rd pass 50 4th pass 50 Water, Coastal Marsh, Upland, and OTHER
Pixel-based Classification Wheeler Marsh Area, Milford, CT Landsat ETM Sept. 8, 2002 ISODATA Unsupervised Classification 3x3 Majority Filter (coastal marsh & upland)
Object-based Classification (eCognition Image Segmentation and Object Oriented Classification)
OBJECT FEATURES CLASS RELATED FEATURES Color Shape/Size To Neighbor Objects Pixels do not have any meaningful shape characteristics other then their size Texture To Sub-objects Hierarchy To Super-objects Object-based Classification eCognition • Image segmentation and image object classifier • Does not classify single pixels, but image objects produced through image segmentation • Image objects are, simply put, contiguous groups of image pixels with similar characteristics.
Landsat 15m Panchromatic Principal Components 1,2,4,6 NDVI Wetness Object-based Classification Input Data Landsat 30m 7-band multispectral
Object-based Classification Image Segmentation LEVEL 2 INPUT LAYERS Landsat RED Landsat NEAR-INFRARED Landsat MID-INFRARED Landsat MID-INFRARED NDVI (greenness) PC1 (brightness) Wetness (wetness) Panchromatic WEIGHTS 1.0 1.0 1.0 1.0 1.0 1.0 1.0 1.0 Scale parameter: 75 Color: 0.9 Shape: 0.1 Smoothness: 0.5 Compactness: 0.5
Land Like (based on WETNESS) Water Like (based on WETNESS) Object-based Classification Image Segmentation LEVEL 2
INPUT LAYERS Landsat RED Landsat NEAR-INFRARED Landsat MID-INFRARED Landsat MID-INFRARED NDVI (greenness) PC1 (brightness) Wetness (wetness) Panchromatic WEIGHTS 1.0 1.0 1.0 1.0 1.0 1.0 1.0 1.0 Object-based Classification Image Segmentation LEVEL 1 Scale parameter: 15 Color: 0.9 Shape: 0.1 Smoothness: 0.5 Compactness: 0.5
Forest High Tidal Marsh Low Tidal Marsh Water Developed Barren Bright Dev. Dark Dev. Dense Dev. Forest Green Grass Yellow Grass High Marsh High Marsh Bright Low Marsh Sparse Dev. Water Rounded Water Linear Object-based Classification Sample Training Data Image objects exported to ESRI shapefile
Object-based Classification See5 Data Mining Tool • See5 is used to extract patterns from substantial databases. • See5 analyzes the data and develops decision trees or sets of if-then rules.
Object-based Classification Image Segmentation LEVEL 1
Classification Integration IMAGINE Knowledge-based Engineer
Classification Integration IMAGINE Knowledge-based Engineer ISODATA Classification 1. Water 2. Tidal Wetland 3. Upland Object-based Classification 1. Water 2. Low Tidal Marsh 3. High Tidal Marsh 4. Upland Pixels not captured in the integration were extracted and classified using ISODATA
Upland High Tidal Marsh Low Tidal Marsh Water Final Tidal Wetland Classification
Photointerpreted Marsh Classified as High Marsh Classified as Low Marsh Classified as Water Final Tidal Wetland Classification Comparison with Photointerpreted Marshes
Outline • Salt Marshes 101 • Moderate resolution remote sensing of tidal marshes • Airborne LIDAR and satellite high resolution remote sensing of salt marsh grasses • Classification of tidal wetland communities using multi-temporal, single-season QuickBird imagery
Very aggressive Forms dense monocultures Displaces indigenous vegetation Does not support rich mix of wildlife Spreads rapidly Physically changes marshes Phragmites australis
1968 1994 Spreads Rapidly - Lord Cove
Goals • Primary goal is to use remote sensing data to map Phragmites australis • Secondary goal is to map other commonly vegetation types / communities • Using a combination of remote sensing data including Landsat, QuickBird, ADS40 and LIDAR.
Project Location 100 km2 area at the mouth of the Connecticut River
550 m Project Location
Typha spp. S. patens Phragmites
LIDAR Data Collection Area LIDAR data provide through a grant from the NOAA Coastal Service Center
LIDAR Data Specifications • Acquired October 8, 2004 using a Leica ALS50 scanner (multiple returns) • ~ 300 square kilometer area, 41 Flight Lines • Average ground sampling distance 0.9 m • Vertical accuracy assessment – at 21 QC test points, the average error = 0.002 m • Horizontal accuracy 0.5 m • Data delivered as 264 tiles of LAS (~14 GB) and text files (~30 GB) • Attribute data includes: x, y, z, intensity, # of returns, return #, classification (non-ground, ground, outliers, water)
Phragmites australis Typha angustifolia Spartina patens
12’ 6’ 0’
Phragmites australis Typha angustifolia Spartina patens
Ground & Non-ground Returns Typha spp. S. patens Typha spp. S. patens P. australis S. patens Typha spp. P. australis S. patens P. australis mix