Download
1 / 30
300 likes | 444 Views
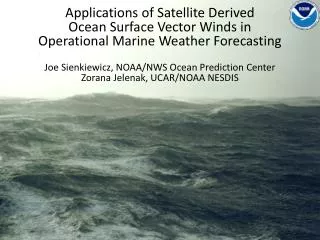
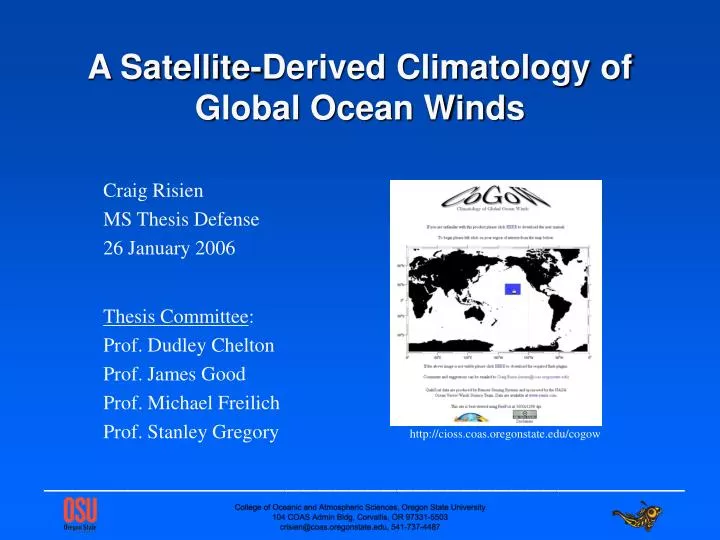
A Satellite-Derived Climatology of Global Ocean Winds. Craig Risien MS Thesis Defense 26 January 2006. Thesis Committee : Prof. Dudley Chelton Prof. James Good Prof. Michael Freilich Prof. Stanley Gregory. http://cioss.coas.oregonstate.edu/cogow. Introduction

E N D
A Satellite-Derived Climatology of Global Ocean Winds Craig Risien MS Thesis Defense 26 January 2006 Thesis Committee: Prof. Dudley Chelton Prof. James Good Prof. Michael Freilich Prof. Stanley Gregory http://cioss.coas.oregonstate.edu/cogow
Introduction Previously Published Atlases Marine Climatic Atlas of the World Atlas of Surface Marine Data 1994 A Scatterometer-based Climatology of Global Ocean Winds (COGOW) An introduction to Dual Pencil-BeamScatterometry Ehime Maru: A case study Examples of Observable Phenomena Within COGOW Conclusions Presentation Outline
Winds influence the ocean at all scales Surface gravity waves & large-scale ocean currents Winds affect exchanges between the ocean & the atmosphere Heat, moisture, gases & particulates Winds are important from a societal standpoint Oil and gas companies & oil spill responders Coast Guard search and rescue operations Resource managers Commercial/recreational maritime activities High school and university natural science instructors Introduction
Marine Climatic Atlas of the World (1850-1970) Atlas of Surface Marine Data 1994 (1945-1989) Derived primarily from in situ ship and buoy observations, that are highly variable in time and space Large portions of the tropics and the southern oceans are significantly under-sampled They cannot truly resolve global ocean winds Previously Published Atlases
Marine Climatic Atlas of the World (1850-1970) http://www.nesdis.noaa.gov/ Valley Library (Compact Disc) Previously Published Atlases (Cont.)
Atlas of Surface Marine Data 1994 (1945-1989) http://ingrid.ldgo.columbia.edu/ Previously Published Atlases (Cont.)
5-Year Climatology (August ’99 - July ’04) monthly composite maps (wind speed & direction) wind rose plots (frequency of wind speed & direction) Data derived from NASA’s Quick Scatterometer (QuikSCAT) High spatial resolution (0.5ox0.5o) The Climatology of Global Ocean Winds(COGOW)
An Introduction to Dual Pencil-Beam Scatterometry • SeaWinds scatterometer launched on 19 June 1999 onboard the QuikSCAT satellite (August 1999 - Present) • SeaWinds is an active microwave radar • Measures 10-m vector winds (25 km2) using electromagnetic backscatter from a wind roughened ocean surface • Accuracy: 1.68 m.s-1 and 14o (equivalent to the accuracy of well calibrated buoys) • ~ 90 % daily global coverage http://winds.jpl.nasa.gov/
Why microwave remote sensing? An Introduction to Dual Pencil-Beam Scatterometry (Cont.) Figure courtesy of M. Freilich
So how is it that QuikSCAT measures wind speed and wind direction over the ocean? An Introduction to Dual Pencil-Beam Scatterometry (Cont.) Gravity capillary waves ( 2 cm) http://meted.ucar.edu/ Figure courtesy of M. Freilich
The Model Function relates surface wind speed and relative wind direction, radar viewing geometry, and backscatter cross section Viewing Geometry Radar Polarization Relative Wind Direction Backscatter cross section Wind Speed (Independent of Direction) Radar Signal Wavelength An Introduction to Dual Pencil-Beam Scatterometry (Cont.) Figures courtesy of M. Freilich
9 February 2001 USS Greeneville (Los Angeles class submarine) collided with a Japanese training and fishing vessel Ehime Maru Ehime Maru sank in ~ 600 m of water, ~17 km south of Diamond Head (Oahu, Hawaii) 26 of 35 crew members were rescued 9 remaining crew members were assumed trapped inside the vessel Ehime Maru: A Case Study
Under mounting int’l pressure the US Navy agreed to attempt to recover Ehime Maru crewmembers, their personal effects, and certain unique characteristic ship components National Environmental Policy Act (NEPA), 1969 Environmental Assessment (EA) EA resulted in a Finding Of No Significant Impact (FONSI) Reef Runway, preferred shallow-water recovery site The Recovery Operation Department of the Navy (2001)
Based on the Reef Runway shallow-water recovery site,NOAA OR&R modeled the behavior of an uncontained diesel fuel release over a 24 hour period wind direction tide conditions (ebb or flood) Model constants wind speed (10 knots), 10 year August mean at Honolulu Int’l diesel fuel released (20,000 gallons) The Recovery Operation (Cont.)
NOAA OR&R Model Results East Wind Ebb Tide Flood Tide Department of the Navy (2001)
NOAA OR&R Model Results (Cont.) East-Northeast Wind Ebb Tide Flood Tide Department of the Navy (2001)
How representative is the assumed wind speed of 10 knots? How variable is the August wind field off the island of Oahu in terms of wind direction? Two Questions Arise
http://cioss.coas.oregonstate.edu/cogow Climatology of Global Ocean Winds
How representative is OR&R’s wind speed of 10 knots? How variable is the August wind field off the island of Oahu in terms of wind direction? COGOW shows average wind speed of 15-20 knots COGOW shows low variability in wind direction (98% E-ENE) OR&R results showed high potential for beach contamination during east & east-northeast wind events for both ebb & flood tide conditions If the fuel tanks of Ehime Maru had ruptured during the recovery operation, the responders may have been somewhat unprepared for the resulting oil spill Ehime Maru: A Summary
The South Asian Monsoon Evidence of SST & wind field coupling Gap Winds Corner Accelerations Examples of Observable Phenomena Within COGOW
COGOW is a 5-year (August 1999 - July 2004) climatology of the QuikSCAT dataset It provides the first high spatial resolution, observationally based, atlas of global ocean winds This global coverage provides valuable information about the wind statistics in the many regions of the world ocean that are sparsely sampled by ships and buoys COGOW enables users to retrieve wind statistics, both in tabular and graphic form, for any region of interest through an easy-to-use web interface The west coast regional node of NOAA’s CoastWatch project has expressed interest in including COGOW in their suite of satellite ocean remote sensing data products It is hoped that this new product will be made available in 2006 Conclusions http://cioss.coas.oregonstate.edu/cogow
I would like to thank, first and foremost, my advisor, Prof. Dudley Chelton, for his guidance and support, throughout my graduate career here at OSU. Thank-you for believing in me. I would also like to thank the members of my committee, Prof. James Good, Prof. Michael Freilich and Prof. Stanley Gregory, as well as NOAA OR&R for their input and interest in this project. Thanks to my friends in Burt 426, Antonio, Eric, Larry, and Renellys for various discussions and help with regards to Matlab, JavaScript, Cal-Comp, HTML and data analysis. But more importantly, thanks for all the laughs, beers, fishing trips, bowling nights, ski days, hikes, barbecues, and coffee and lunch breaks. To all the people within COAS and OSU who have touched my life both personally and professionally over the past 2.5 years, thank-you. I want to express my sincere appreciation for the unwaveringsupport that I have received from my partner, Julie Barr, and from my friends and family in South Africa, the UK and Holland. Acknowledgements