Download
1 / 22
220 likes | 237 Views
Learn about GEOGLAM's phased implementation approach, main components, capacity building projects, country monitoring initiatives, and cross-cutting research and development efforts. Discover how Earth observation data is used for global crop monitoring, capacity building, and early warning systems.

E N D
GEOGLAM Update Michel Deshayes, GEOInbal Becker-Reshef, Alyssa Whitcraft, UMD GEOGLAM Working GroupCEOS SIT-29 Side Meeting CNES, Toulouse, France9th-10th April 2014
GEOGLAM Activities3 Components + 3 Cross Cutting Components 4. EO DATA COORDINATION 5. METHOD IMPROVEMENT through R&D coordination (JECAM) 6. Data, products and INFORMATION DISSEMINATION Stakeholders Governments AMIS FAO
GEOGLAM & CEOS Collaboration Phased Implementation Approach • Phased approach developed by GEOGLAM Ad-Hoc Team mandated Nov. 2012, refined March/June 2013 • Subsequent, overlapping phases • Phase 1 (2012-2014): focuses on foundation activities, building on existing activities & pilot projects for a few countries, scoping out the programme, & establishing requirts • Phase 2 (2014-2016): reviews and expands P1 activities with new starts • Phase 3 (2015-2017): the last building pre-operational phase with the completion of P1/P2 projects and geographical expansion; • Phase 4 (late 2017 onward): the operational phase
GEOGLAM Activities Main Component #1 activities Crop Monitor: Coordinated Global Crop Assessments(4 main crops, ~30 main producers) Monthly operational report to AMIS (G-20 Agricultural Market Information System, with secretariat hosted at FAO) Synthesizes monitoring activities andprovides consensus global crop assessments (Coordinated by UMD with NASA support) Participating Agencies include: USDA NASS (National Agricultural Statistics Service) & FAS (Foreign Agricultural Service) EC-JRC MARS (Monitoring Agricultural Resources) & Agri4Cast (Agricultural Forecasts) China: RADI-CAS CropWatch Russia VEGA (Satellite based service for vegetation monitoring) India: FASAL (Forecasting Agriculture using Space, Agro-met. & Land based observations) & NADAMS (National Agricultural Drought Assessment & Monitoring System) Canada: NCMS (National Crop Monitoring System)… Brazil: CONAB GeoSafras Japan + China + INDIA + ASEAN: ASIA-RiCE project Other countries: Australia, Mexico, Argentina, South Africa…
GEOGLAM activities Main Component #2 – Capacity Building On-going national projects Argentina (INTA - UMD - NASA) Pakistan (CRS – SUPARCO – FAO - UMD – NASA) Ukraine (IKD – HydroMet - EC) South Africa (NEOSS – ARS)… Main Component #3 – Countries at Risk On-going international monitoring Projects FAO GIEWS (Global Information & Early Warning System) US FEWSNET (Famine Early Warning System) EC MARS Food Security Bulletins China CropWatch Drought & Food security activities… Cross Cutting Component R&D – JECAM Objective: to reach a convergence of approaches, develop monitoring & reporting protocols and best practices for a variety of global agricultural systems About 40 test-sites on all continents!
Present use of EO data in GEOGLAM projects EO data for Component #1 – Global Crop Monitoring for AMIS GEOGLAM Monthly Crop Monitor Wheat, Maize, Soy Use of low resolution optical data (MODIS), together with Met data (GCOM-W, TRMM…) and with moderate resolution crop type masks CEOS data used to-date : Optical Low Res, Optical Moderate Res Future: sampled optical high resolution ; microwave SAR Rice Rice regions: China, India, South-East Asia (90% world prod. & consumption) South-East Asia : up to 3 rice crops/year, important cloud cover (intertropical region) Rice monitoring, using AgroMet data (GCOM-W, TRMM…) & local experts Asian collaborative network, coordinated by JAXA (S. Sobue) CEOS data used to-date : Optical Low Res. (OLR) ; microwave SAR (just starting)
AMIS members: 80%-90% World Production & Exports Maize production 2012 – 2014 average Soybean production 2012 – 2014 average Wheat production 2012 – 2014 average Wheat Exports 2012 – 2014 average Soybean Exports 2012 – 2014 average Rice Exports 2012 – 2014 average Maize Exports 2012 – 2014 average
GEOGLAM Crop Monitor in AMIS Market Monitor October November September December Operational GEOGLAM Global Crop Condition Assessments published monthly within the G-20 AMIS Market Monitor Bulletin
Present use of EO data in GEOGLAM projects EO data for Component #2 – Capacity Building National CB projects based on: Optical Low (MODIS), Moderate (TM), High (Spot, RapidEye) resolution data, together with AgroMet info, used in Crop Yield Forecast Models, with local experts Argentina, Ukraine, Morocco, South Africa, Ethiopia… CEOS data : optical low / medium / high resolution (Free-of-Charge + Commercial) ASIA-RiCE project, a multi-national rice- monitoring project: for 8 ASEAN countries, with JAXA coordination & participation of India & China CEOS : from Autumn 2013, use of SAR data (Scan à HiPrec. modes) for national & sub-natl Crop area assessment & Crop yield forecast, obt. Through CEOS EO data for Component #3 – Countries at Risk Early Warning Systems based on: Multi-source information: AgroMet & Optical Low Resolution data, moderate and high resolution + expertise
C#2-CB – ex. Pakistan: Strengthening Provincial Capacity (collaboration between USDA, FAO, SUPARCO, CRS Pakistan, & UMD) Training Workshops
C#2-CB – ex. Use of SAR data for Rice Monitoring 10 CosmoSkymed acquisitions Intensive measurements Extensive measurements Aug Sep Oct Nov Dec 2013 Examples of products obtained from multitemporal SAR data Use of 10 CosmoSkymed scenes / 4.5 months, Autumn-Winter 2013 crop An Giang test-site (Vietnam) : August:19; September: 4, 20 ; October: 6, 14, 22, 30; November: 7, 15, 23
C#2-CB – ex. Use of SAR data for Rice Monitoring Camargue (France), 1988 X band airborne SAR tillering 2-3 leaves stem extension Two experiments, same scattering physics Angle : 50-55° An Giang (Vietnam), Aug-Oct 2013 CosmoSkymed, X band SAR 30 cm 10 cm 30 cm 4 Sept. 70cm 19 August 70 cm 20 Sept. 6 Oct. 18 Oct. Conclusion: AgMon needs multidate imagery (opt-SAR) within same growing season
C#2-CB – ex. Use of SAR data for Rice Monitoring Season_1 Season_2 Season_3 Rice mapping Map of rice fieldsSeason-1_2014 Single-date vs 2-dates White: Fields detected with one date only (Jan 26) Green: additional fields detected with 2nd image (Feb 11) With 2 dates, 26/01 & 11/02, almost all rice fields in Thoai Son and Chau Thanh have been detected Conclusion: AgMon needs multidate imagery (opt-SAR)within same growing season
JECAM study sites represent many of the world’s main cropping systems Over 30 sites currently exist or are in development. Several new sites associated with EC FP7 SIGMA Project. R&D Component – JECAM
JECAM Summary Phase 1 18 • JECAM, foundation of GEOGLAM R&D component • JECAM requirements now part of GEOGLAM requirements • 2013 Annual Report delivered yesterday • 23 sites reporting • State of the Science for Ag Monitoring (Crop Area, Crop Cond, Yield Forecast, Soil Moisture, Management Practices) • A rich set of scientific results, produced by expert teams around the world, in a wide variety of geographic settings and cropping systems, available for sharing and definition of ‘best practices’ Provides clear indication of the impact of CEOS support
JECAM Proposed Way Forward - Phase 2 19 • Better coordinating in-situ & satellite data for sharing across sites • Define and create minimum in-situ & EO data sets • Subset of JECAM sites TBD (willing, able, and representative) • Medium to High Res Imagery data sets (i.e. RapidEye; Landsat, Sentinel 1&2, Radarsat 2, TerraSAR-X, MODIS, etc) TBD • In-situ data sets (create standards – Defourny) • Open data licenses to share between all JECAM sites • Find data management solution (discovery, access) – SDMS ? • Link with Space Data Management System (SDMS) • GFOI, first user of SDMS • JECAM second user : 4-5 JECAM sites to be identified
Component #4: Coordination of EO Data • Requirements established to meet many target products • Candidate missions identified • Phase 1 is ongoing – foundation activities successful
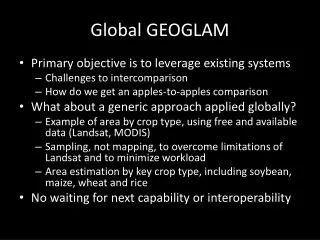
Revisit Frequency Required (RFR) for: • Reasonably clear view every 8 days during Agric. Growing Season • Over all sizes of fields • Sample (prefer cropland extent [shown]) Most months or areas require 3-5 day revisit 22-31% of cells need only an 8-day revisit (RFR = 8) 44-55% of cells have RFR <4 days 74-92% of cells have RFR <4 days 38-60% of cells have RFR <2 days Best Case Best Case RFR for Final Percentage Clear >= 70% Worst Case Worst Case RFR for Completely Clear View Source: Whitcraft et al. (UMD)
Next Steps Strengthening the CEOS-GEOGLAM Relationship • CEOS data coordination are crucial for GEOGLAM implementation! • Ad hoc Team is making good progress at forging two communities • So far: • Requirements established • Candidate missions to meet requirements identified • Next: • Formalize process of translating requirements into data requests • Data distribution system – e.g. NASA SDMS, ESRI, etc. • Track data - requests from GEOGLAM, coordination by CEOS, data use by GEOGLAM • EO Data • HiRes or Very HiRes Optical data (Ikonos, Worldview, Quickbird, RapidEye..) • HiRes SAR data (CosmoSkymed, Radarsat, TerraSAR-X…)