Download
1 / 40
480 likes | 784 Views
INDE 2333 ENGINEERING STATISTICS I LECTURE 1. University of Houston Dept. of Industrial Engineering Houston, TX 77204-4812 (713) 743-4195. AGENDA. Some statistics related quotes Importance of Probability and Statistics Basic Concepts Treatment of data. SOME STATISTICS RELATED QUOTES.

E N D
INDE 2333 ENGINEERING STATISTICS I LECTURE 1 University of Houston Dept. of Industrial Engineering Houston, TX 77204-4812 (713) 743-4195
AGENDA • Some statistics related quotes • Importance of Probability and Statistics • Basic Concepts • Treatment of data
SOME STATISTICS RELATED QUOTES • “Not all that can be counted counts, not all that counts can be counted” • In order to improve a process, you must first be able to measure it • Right the first time • There are three types of liars: • Liars, damn liars, and statisticians
IMPORTANCE OF PROBABILITY AND STATISTICS • Walter Shewhart, 1920’s • Japan’s manufacturing rise, 1950’s • U.S. Manufacturing Crisis, 1980’s • Crosby, “Quality is Free” • Juran • Deming, 14 points • Malcolm Baldridge Award • Tom Peters, Harley-Davidson • Tools • Ishikawa, Pareto, and SPC Charts • JIT • Benchmarking • 6 Sigma, Motorola
BASIC CONCEPTS • Unit • Single entity of interest • Different measures • Population • Set of all units of interest present • Sample • Subset of the population present • Measurements actually collected • Samples should random not be biased • Sample size • Number of units in the sample that are taken for measurement
EXAMPLE • Sample Mean • Average value of sample • Sample Standard Deviation • Measurement of spread or variation in measurements • Situation • Company uses automatic equipment to fill bottles • FDA requires that the bottles be filled a minimum amount • FDA fines company when bottles are not • Automatic filling processes has inherent variation
VODKA, KETCHUP, ETC observations ml 1000 FDA 1002 1010
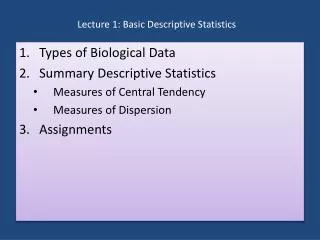
TREATMENT OF DATA • General Concepts • Pareto and Dot Diagrams • Frequency Distributions • Graphs of Frequency Distributions • Descriptive Measures • Quartiles and Percentiles • X bar and s
GENERAL CONCEPTS • Raw statistical data from surveys, experiments, etc can be too overwhelming to understand • The data must be condensed and represented in a manner that is more easily understood • Graphically • Tabular or Numerical form
PARETO DIAGRAMS • Special bar chart • Based on the Pareto 80-20 Principle • Ordered in descending order of interest • Allows attention to be directed on most important areas • Frequently include cost related data
PARETO CHARTGasket Ring Number Of Obs Hole Too Large Hole Too Small Chipped Scratched All Others
PARETO CHARTGasket Ring Cost of Defects Hole Too Small Hole Too Large Chipped Scratched All Others
DOT DIAGRAMS • Visually summarizes individual data • Check for unusual patterns • Easily identifies outliers • Differences in data sources • Machines • Personnel • Materials
DOT DIAGRAMS -5 5 0 Deviation from nominal value in um Night Shift Day Shift
FREQUENCY DISTRIBUTIONS • Table of data • Divided in classes / categories / cells • Number of cells is usually related to the total obs • Class / category / cell limits • Class / category / cell frequencies
CUMULATIVE DISTRIBUTION • Total number of observations less than a given value
GRAPHS OF FREQUENCY DISTRIBUTIONS • Histogram of cell observations • Horizontal or vertical • Size is based on observations in each cell
OGIVE • Graph of cumulative distribution
STEM AND LEAF DISPLAYS • Smaller sets of data • Does not lose any information • Class, as well as, actually data values • Data values are listed to the right of the classes
DESCRIPTIVE MEASURES • Mean • Median • Mode • Minimum • Maximum • Range • Variance • Standard Deviation • Coefficient of variation
MEAN • X bar • Arithmetic average of all values • Sum of all values divided by number of values • Sample mean and population mean
MEDIAN • “Middle value” • Observations are ordered from smallest to largest • Median observation depends on number of obs • Odd number of observations • (n+1)/2 • For 5 observations, median is value of (5+1)/2=3rd observation • Even number of observations • Median value is average of the two observations in positions n/2 and (n+2)/2 • For 6 observations, average values of 3rd and 4th observations
MODE • Most common value
MINIMUM • Smallest value
MAXIMUM • Largest value
RANGE • Method to measure the dispersion of the values • Largest value minus the smallest value • Can be misleading when outliers are present • Does not take into account the distribution of bunching of values • Simple and fast to calculate so commonly used in industry particularly with SPC charts
RANGE = Maximum value – minimum value
SAMPLE VARIANCE • Absolute measure of dispersion • When many values are away from the mean, the variance is large • When many values are close to the mean, the variance is small • Based on • Sample mean • Squared difference of observations from sample mean • Number of observations in sample
SAMPLE STANDARD DEVIATION • Absolute measure of dispersion • Based on square root of variance
QUARTILES AND PERCENTILES • Quartiles • Groupings of 25% observations • 1st, 2nd, 3rd, 4th quartile • Percentiles • At least 100 p % are at or below value • At least 100 (1-p) % are at or above value
PROCEDURE FOR CALCULATING PERCENTILES • Order observations smallest to largest • Calculate n * p • Not an integer • Round up to next highest integer and find value • Integer • Calculate mean of kth and (k+1)th observations
BOX PLOT Q1 Q2 Maximum Minimum Median