Download
1 / 20
200 likes | 211 Views
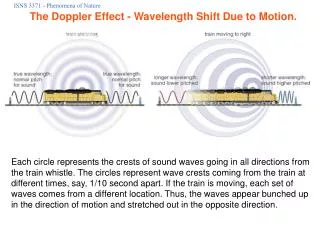
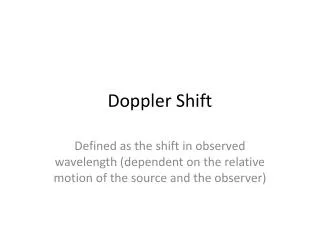
This study investigates the Doppler shift oscillations in a hot flare line, Fe XXI, observed by IRIS. The oscillations have two periods: a shorter period of ~3.1 minutes and a longer period of ~10 minutes. The shorter period may be explained by the MHD wave in a standing kink mode, while the longer period may be caused by a slow wave.

E N D
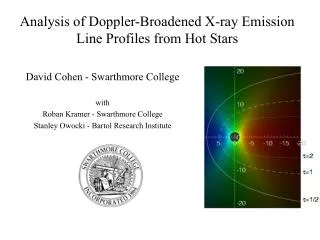
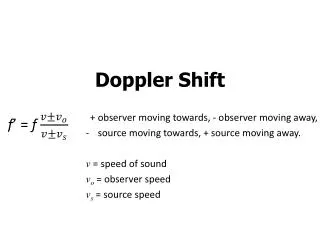
ISSI-BJ 2017 October 18 Doppler shift oscillations from a hot line observed by IRIS Dong Li (lidong@pmo.ac.cn) Co-authors: Zongjun Ning, Yu Huang, N.-H. Chen, Qingmin Zhang, Yingna Su, and Wei Su Purple Mountain Observatory, CAS
Outlines • Backgrounds • Imaging observations • Spectroscopic observations • Observations and results • Discussions • Summary
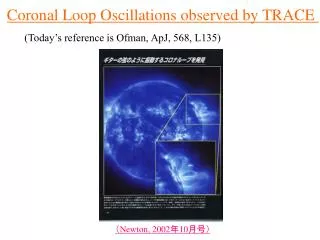
Imaging observations • Coronal loop often displays the spatial displacement oscillations in EUV images AIA 171,211, and 304 Å
Imaging observations • The displacement amplitude of coronal loop oscillations has two types: The displacement amplitude is large but decaying quickly with time. The displacement amplitude is small and decayless. Su et al. 2017 Anfinogentov et al. 2015 Kink oscillations
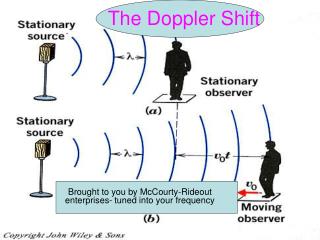
Spectroscopic observations • The coronal loop oscillations can be detected in Doppler shifts of the emission lines, such as, the coronal line of Fe XIX Wang et al. 2002 Standing wave
Spectroscopic observations • Doppler shift oscillations can be observed in warm (1.3–2.0 MK) coronal lines: long-lasting Kink oscillations Coronal loop Tian et al., 2012
Spectroscopic observations Global fast sausage mode Tian et al., 2012
Observations • M7.1 Flare • AR 12192 • 2014-Oct-27 • Hot loop • IRIS slit • sit-and-stare
IRIS spectral fitting • Fe XXI is a broad and hot (~11 MK) emission line, it is always blended with other emission lines, such as C I, Si II, Fe II et al. • We used multi-Gaussian fitting (purple) to obtain Fe XXI (sky blue) from these blended lines (Li et al., 2015). • The line profiles and line center of Fe XXI from the fitting results.
Fitting results • The Doppler shifts between two green lines display oscillatory behaviors, and the oscillations change from red shift to blue shift. • The line intensities do not display the similar oscillations.
Time series • The time series of Doppler velocity display 6 peaks during the flare impulsive phase. • 5-min running average. • The time series of line intensity from Fe XXI (sky blue), SXR and microwave emissions do not display the similar peaks during the flare impulsive phase.
Wavelet analysis • (a): Detrended time series of Doppler velocity • (b) and (c): Wavelet power spectrum and global wavelet P=3.1±0.6 minutes (Torrence & Compo 1998; Yuan et al. 2011; Tian et al. 2012)
Flare loop • A broad loop along the IRIS slit, two green lines mark the loop top region. • Loop length (purple) L ≈ 81 Mm • Loop width W ≈ 9.8 Mm • DEM analysis positions (po & pi, Cheng et al., 2012)
DEM analysis • Black profile: The best-fitted DEM solution of the observations. • Color rectangles: the Monte Carlo (MC) realizations of the observations. • The density ratio between outside (po) and inside (pi) flare loop: n0/ne≈0.03 (Zucca et al. 2014)
Light curves • When the Doppler shift starts to oscillate, the temperature happens to increasing, but not oscillating within the same period. • AIA EUV fluxes do not display the oscillations with the same period. • Sine function fitting (e.g., Nakariakov et al. 1999; Wang et al. 2002; Anfinogentov et al. 2015)
Detrend time series • It is applied to the time series by removing the 12-min running average.
FFT spectra • We perform a Fourier analysis (Scargle 1982; Horne & Baliunas 1986) for the detrend time series of Doppler velocity, line intensity of Fe XXI, SXR and EUV fluxes. • P1=~3.1±0.6 min • P2=~10 ± 4 min
Discussions • The shorter period (P1) is most probably a fast kink wave (Roberts et al. 1984; Nakariakov & Ofman 2001; Tian et al. 2012) • The Alfv´en speed can be estimated to be about 630 km s−1, and the magnetic filed strength in this flare loop can be estimated to be about 68 G. • The longer period (P2) might be explained as a slow wave. 1. The local sound speed: vs=152(T/MK)0.5≈500 km s-1 (Kumar et al. 2013) 2. The phase speed: vh=2L/P2≈200~450 km s-1 (Mandal et al. 2016)
Summary • The Doppler shift oscillations within double periods are observed in a hot flare line, i.e., Fe XXI 1354.09 Å. One is a shorter period of ~3.1 minutes, another is a longer period of ~10 minutes. • There are no apparent corresponding oscillations within the shorter period of ~3.1 minutes in the line-integrated intensity, AIA EUV fluxes, or microwave emissions, suggesting that the oscillations of flare loop is weakly compressible. • The 3.1-min period of Doppler shift oscillations at Fe XXI 1354.09 Å might be explained by the MHD wave in a standing kink mode. • The 10-min period oscillations can also be observed in GOES SXR fluxes, SDO/AIA EUV light curves and the time series of line intensity of Fe XXI, which might be caused by a slow wave.
Thanks for your attention!