Download
1 / 73
1.15k likes | 1.91k Views
Beef Grading. J. Brad Morgan Oklahoma State University. Inspection Wholesomeness USDA Food Safety Inspection Service Veterinarian Mandatory Taxpayer funded. Grading Value – Quality and Yield USDA Agricultural Marketing Service Grader Voluntary Packer pays per hour. Grading.

E N D
Beef Grading J. Brad Morgan Oklahoma State University
Inspection • Wholesomeness • USDA Food Safety Inspection Service • Veterinarian • Mandatory • Taxpayer funded Grading • Value – Quality and Yield • USDA Agricultural Marketing Service • Grader • Voluntary • Packer pays per hour
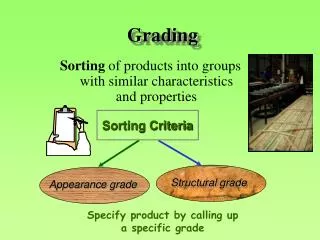
Grading • The process of dividing a commodity into groups which differ in the marketing process • Grades: • Must be based on factors that are important to buyers and sellers • Should reflect the final use of the product • Should be practical and conform, as closely as possible, to existing trade practices
Beef Grading • Segregating of cattle and beef carcasses based on expected value • 1923 use of tentative standards • 1926 USDA promulgated official standards
Gender Determination • Bull • Steer • Bullock • Heifer • Cow
Dressing Percentage • HCW/LW * 100 • Steers & Heifers = 61 – 66% • Cows = 48% (very variable) • Affected by: • Fill • Finish (fat) • Muscling • Mud, Horns, Etc.
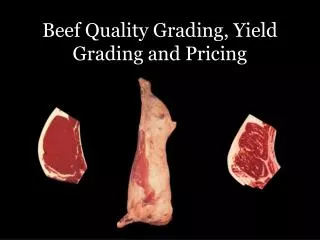
Yield Grading • USDA YG 1, 2, 3, 4 or 5 • To predict CUTABILITY • Percent boneless, closely trimmed retail cuts from the round, loin, rib, and chuck • 1 = highest cutability (more muscle; less fat) • 5 = lowest cutability (less muscle; more fat)
Yield Grading Factors • Fat Thickness = Preliminary Yield Grade (PYG) • Hot Carcass Weight (HCW) • Ribeye Area (REA) • Kidney, Pelvic & Heart Fat % (KPH)
Ribbing • Between the 12th & 13th Rib • Bloom Time = approx. 15 min for oxygenation of the ribeye
Fat Thickness (PYG) • ¾ Distance opposite the ribeye • Can measure as fat thickness or PYG • Must convert if use fat thickness • Also, make adjustments based on fat of entire carcass
Fat Thickness to PYG • 0.0” fat = 2.0 PYG • For every 0.1” increase in fat increase PYG 0.25 • 0.1” = 2.25 PYG • 0.2” = 2.5 PYG • 0.3” = 2.75 PYG • 0.4” = 3.0 PYG • 0.6” = 3.5 PYG • 0.8” = 4.0 PYG • 1.2” = 5.0 PYG
Hot Carcass Weight & Ribeye Relationship • 600 lbs carcass requires an 11.0 sq. in. ribeye • Each 100 lbs increase in carcass weight requires an additional 1.2 sq. in. REA • 700 lbs carcass requires 12.2 • 800 lbs carcass requires 13.4 • 500 lbs carcass only requires 9.8
HCW/REA Schedule HCW REA HCW REA 50009.8 700 12.2 525 10.1 725 12.5 550 10.4 750 12.8 575 10.7 775 13.1 600 11.0 800 13.4 625 11.3 825 13.7 650 11.6 850 14.0 675 11.9 875 14.3
HCW/REA adjustment • If larger than needed, subtract from PYG • If smaller than needed, add to PYG • For every 0.3 difference from needed size add or subtract 0.1 to PYG • Examples: • 600 lbs/11.0; measures 12.2; -0.4 to PYG • 800 lbs/13.4; measures 12.5; +0.3 to PYG • 750 lbs/12.8; measures 16.8; -1.3 to PYG
Kidney, Pelvic & Heart Fat Percentage • Based on percentage of HCW • 3.5% = 0.0 adjustment • For every 0.5% deviation from 3.5 +/- 0.1 adjustment to PYG • If more than 3.5%, add to PYG • If less than 3.5%, subtract from PYG
KPH • 5.0% = +0.3 • 4.5% = +0.2 • 4.0% = +0.1 • 3.5% = 0.0 • 3.0% = -0.1 • 2.5% = -0.2 • 2.0% = -0.3 • 1.5% = -0.4
Determining USDA YG • Determine PYG • Make Adjustments to PYG • HCW • REA • KPH • Examples!!!
HCW = 700 PYG = 2.7/2.8 REA = 15.5 KPH = 2.0% YG = 1.5
HCW = 784 PYG = 3.0/3.2 REA = 14.4 KPH = 2.5% YG = 2.6
HCW = 636 PYG = 3.1/3.4 REA = 10.8 KPH = 3.0% YG = 3.5
HCW = 801 PYG = 4.3/4.5 REA = 13.1 KPH = 3.0% YG = 4.5
HCW = 738 PYG = 4.8/5.2 REA = 12.0 KPH = 4.0% YG = 5.5
USDA YG %BCTRC 52.3 % or more 52.3 - 50.0% 50.0 - 47.7% 47.7 - 45.4% 45.4% or less 1 2 3 4 5 USDA Yield Grade
Quality Grading • Estimates palatability • Tenderness, Juiciness & Flavor • Based: • Maturity (Physiological) • Marbling Score
“Young” – cattle < 42 mos. Prime Choice Select Standard “Old” (Hardbone) – cattle > 42 mos. Commercial Utility Cutter Canner USDA Quality Grades
USDA Quality Grade Factors • Maturity – A, B, C, D, E • Lean Maturity • Lean Color • Lean Texture • Skeletal Maturity • Bone Ossification • Shape & Color of Ribs • Marbling • Amount & Distribution of Intramuscular Fat
Marbling Scores • Abundant • Moderately Abundant (Mab) • Slightly Abundant (Slab) • Moderate (Md) • Modest (Mt) • Small (Sm) • Slight (Sl) • Traces (Tr) • Practically Devoid (Pd) • Devoid (D)
Marbling Slight Modest Small ModeratelyAbundant Moderate Slightly Abundant