Download
1 / 74
740 likes | 802 Views
Explore the key findings of the 1968 research by Evans and Archer on portfolio construction and the impact of diversification on reducing risk. Learn about systematic vs unsystematic risk, implications for investors, and the concept of superfluous diversification. Gain insights on the diminishing benefits of additional securities in a well-diversified portfolio and the importance of rational diversification strategies.

E N D
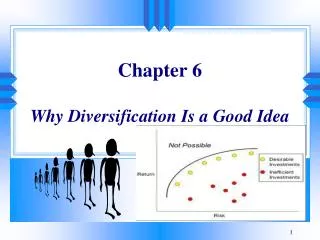
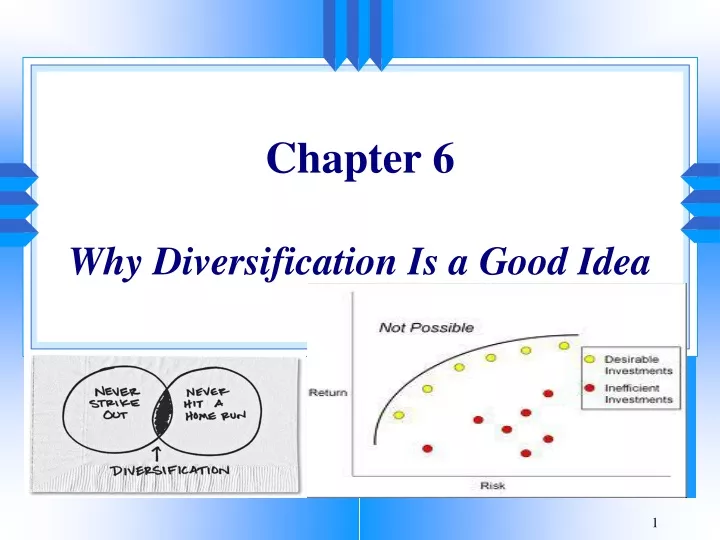
Lessons from Evans and Archer • Introduction • Methodology • Results • Implications • Words of caution
Introduction • Evans and Archer’s 1968 Journal of Finance article • Very consequential research regarding portfolio construction • Shows how naïve diversification reduces the dispersion of returns in a stock portfolio • Naïve diversification refers to the selection of portfolio components randomly
Methodology • Used computer simulations: • Measured the average variance of portfolios of different sizes, up to portfolios with dozens of components • Purpose was to investigate the effects of portfolio size on portfolio risk when securities are randomly selected
Results • Definitions • General results • Strength in numbers • Biggest benefits come first • Superfluous diversification
Definitions • Systematic risk is the risk that remains after no further diversification benefits can be achieved • Unsystematic risk is the part of total risk that is unrelated to overall market movements and can be diversified • Research indicates up to 75 percent of total risk is diversifiable
Definitions (cont’d) • Investors are rewarded only for systematic risk • Rational investors should always diversify • Explains why beta (a measure of systematic risk) is important • Securities are priced on the basis of their beta coefficients
General Results Portfolio Variance Number of Securities
Strength in Numbers • Portfolio variance (total risk) declines as the number of securities included in the portfolio increases • On average, a randomly selected ten-security portfolio will have less risk than a randomly selected three-security portfolio • Risk-averse investors should always diversify to eliminate as much risk as possible
Biggest Benefits Come First • Increasing the number of portfolio components provides diminishing benefits as the number of components increases • Adding a security to a one-security portfolio provides substantial risk reduction • Adding a security to a twenty-security portfolio provides only modest additional benefits
Superfluous Diversification • Superfluous diversification refers to the addition of unnecessary components to an already well-diversified portfolio • Deals with the diminishing marginal benefits of additional portfolio components • The benefits of additional diversification in large portfolio may be outweighed by the transaction costs
Implications • Very effective diversification occurs when the investor owns only a small fraction of the total number of available securities • Institutional investors may not be able to avoid superfluous diversification due to the dollar size of their portfolios • Mutual funds are prohibited from holding more than 5 percent of a firm’s equity shares
Implications (cont’d) • Owning all possible securities would require high commission costs • It is difficult to follow every stock
Words of Caution • Selecting securities at random usually gives good diversification, but not always • Industry effects may prevent proper diversification • Although naïve diversification reduces risk, it can also reduce return • Unlike Markowitz’s efficient diversification
Markowitz’s Contribution • Harry Markowitz’s “Portfolio Selection” Journal of Finance article (1952) set the stage for modern portfolio theory • The first major publication indicating the important of security return correlation in the construction of stock portfolios • Markowitz showed that for a given level of expected return and for a given security universe, knowledge of the covariance and correlation matrices are required
Quadratic Programming • The Markowitz algorithm is an application of quadratic programming • The objective function involves portfolio variance • Quadratic programming is very similar to linear programming
Portfolio Programming in a Nutshell • Various portfolio combinations may result in a given return • The investor wants to choose the portfolio combination that provides the least amount of variance
Concept of Dominance • Dominance is a situation in which investors universally prefer one alternative over another • All rational investors will clearly prefer one alternative
Concept of Dominance (cont’d) • A portfolio dominates all others if: • For its level of expected return, there is no other portfolio with less risk • For its level of risk, there is no other portfolio with a higher expected return
Concept of Dominance (cont’d) Example (cont’d) In the previous example, the B/C combination dominates the A/C combination: B/C combination dominates A/C Expected Return Risk
Terminology • Security Universe • Efficient frontier • Capital market line and the market portfolio • Security market line • Expansion of the SML to four quadrants • Corner portfolio
Security Universe • The security universe is the collection of all possible investments • For some institutions, only certain investments may be eligible • E.g., the manager of a small cap stock mutual fund would not include large cap stocks
Efficient Frontier • Construct a risk/return plot of all possible portfolios • Those portfolios that are not dominated constitute the efficient frontier
Efficient Frontier (cont’d) Expected Return 100% investment in security with highest E(R) No points plot above the line Points below the efficient frontier are dominated All portfolios on the line are efficient 100% investment in minimum variance portfolio Standard Deviation
Efficient Frontier (cont’d) When a risk-free investment is available, the shape of the efficient frontier changes • The expected return and variance of a risk-free rate/stock return combination are simply a weighted average of the two expected returns and variance The risk-free rate has a variance of zero
Efficient Frontier (cont’d) Expected Return C B Rf A Standard Deviation
Efficient Frontier (cont’d) • The efficient frontier with a risk-free rate: • Extends from the risk-free rate to point B • The line is tangent to the risky securities efficient frontier • Follows the curve from point B to point C
Theorem For any constant Rf on the returns axis, the weights of the tangency portfolio B are:
What is the zero-beta portfolio? • The zero beta portfolio P0 is the portfolio determined by the intersection of the frontier with a horizontal line originating from the constant Rf selected. • Property: whatever Rf we choose, we always have Cov(B,P0)=0 (Notice, however, that the location of B and P0 will depend on the value selected for Rf)
Note that the last proposition is true even if the risk-free rate (i.e. a riskless security) doesn’t exist in the economy. • The way the tangency portfolio B was determined also remains valid even if there is no riskless rate in the economy. • All one has to do is replace Rf by a chosen constant c. The mathematics of the last propositions will remain valid.
Fisher Black zero beta CAPM (1972) • For a chosen constant c on the vertical axis of returns, the tangency portfolio B can be computed, and for ANY portfolio x we have a linear relationship if we regress the returns of x on the returns of B: • Moreover, c is the expected rate of return of a portfolio P0 whose covariance with B is zero.
Fisher Black zero beta CAPM (Cont’d) • The name “zero beta” stems from the fact that the covariance between P0 and B is zero, since a zero covariance implies that the beta of P0 with respect to B is zero too. • If a riskless asset DOES exist in the economy, however, we can replace the constant c in Black’s zero beta CAPM by Rf and the portfolio B is the market portfolio.
Capital Market Line and the Market Portfolio • The tangent line passing from the risk-free rate through point B is the capital market line (CML) • When the security universe includes all possible investments, point B is the market portfolio • It contains every risky assets in the proportion of its market value to the aggregate market value of all assets • It is the only risky assets risk-averse investors will hold
Capital Market Line and the Market Portfolio (cont’d) • Implication for investors: • Regardless of the level of risk-aversion, all investors should hold only two securities: • The market portfolio • The risk-free rate • Conservative investors will choose a point near the lower left of the CML • Growth-oriented investors will stay near the market portfolio
Capital Market Line and the Market Portfolio (cont’d) • Any risky portfolio that is partially invested in the risk-free asset is a lending portfolio • Investors can achieve portfolio returns greater than the market portfolio by constructing a borrowing portfolio
Capital Market Line and the Market Portfolio (cont’d) Expected Return C B Rf A Standard Deviation
Security Market Line • The graphical relationship between expected return and beta is the security market line (SML) • The slope of the SML is the market price of risk • The slope of the SML changes periodically as the risk-free rate and the market’s expected return change
Security Market Line (cont’d) Expected Return E(R) Market Portfolio Rf 1.0 Beta
Notice that we obtained very poor results. The R-squared is only 27.93% ! • However, the math of the CAPM is undoubtedly true. • How then can CAPM fail in the real world? • Possible explanations are that true asset returns distributions are unobservable, individuals have non-homogenous expectations, the market portfolio is unobservable, the riskless rate is ambiguous, markets are not friction-free.
We obtained a perfect 100% R-squared this time ! • The reason is that when portfolio returns are regressed on their betas with respect to an efficient portfolio, an exact linear relationship holds.
Expansion of the SML to Four Quadrants • There are securities with negative betas and negative expected returns • A reason for purchasing these securities is their risk-reduction potential • E.g., buy car insurance without expecting an accident • E.g., buy fire insurance without expecting a fire
Security Market Line (cont’d) Expected Return Securities with Negative Expected Returns Beta
Diversification and Beta • Beta measures systematic risk • Diversification does not mean to reduce beta • Investors differ in the extent to which they will take risk, so they choose securities with different betas • E.g., an aggressive investor could choose a portfolio with a beta of 2.0 • E.g., a conservative investor could choose a portfolio with a beta of 0.5
Capital Asset Pricing Model • Introduction • Systematic and unsystematic risk • Fundamental risk/return relationship revisited
Introduction • The Capital Asset Pricing Model (CAPM) is a theoretical description of the way in which the market prices investment assets • The CAPM is a positive theory