Download

1 / 51
510 likes | 607 Views
By: Matthew Irvine and Cristina Belew. Insulation studies. Introduction. Origination and Goals. Partnership with Habitat for Humanity Their goal is to lower the overall cost to owner Studied the effect of insulation on energy costs

E N D
By: Matthew Irvine and Cristina Belew Insulation studies
Origination and Goals • Partnership with Habitat for Humanity • Their goal is to lower the overall cost to owner • Studied the effect of insulation on energy costs • Looked for the effects of different insulations and insulating methods • Recommend the insulations with the lowest cost to owner
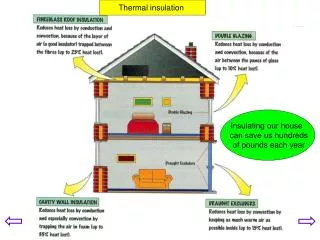
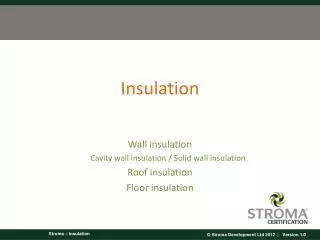
Four Different Areas • Wall insulation types • Framing dimension selection • Attic insulation • Duct Insulation
Design Modeling Assumptions • h and k values • No thermal contact resistance • Siding geometry • No radiation in attic, theoretical venting
Decision of appropriate options • Wall Insulation • Stud Sizing • Duct Insulation
Modeling Techniques • We began with a square foot section • Moved to a larger section with other elements included • Completed our analysis by simulating an entire house (Woodruff House)
Studied Design Description • Small and large wall section for 2X4 and 2X6 • Attic Section • Duct Section
2 x 4 Stud, 1 x 1 m2 Section: Overview Hardiboard • Equation for heat flux • Q = (T2 – T1)/Rtotal • Studied 3 times during the year • January – 2.778 ºC • April – 15.56 ºC • July - 27.2 ºC • Desired inside temperature- 22.2 ºC Insulation Drywall Plywood Air Pocket
2 x 4 Stud, 1 x 1 m2 Section: R-values • R of Convection – 1/h*A • h- convection coefficient (W/m·°C) • A- area of convection (m2) • R of a certain material – L/k*A • k- thermal conductivity • L- thickness of material (m) • A- area of material (m2) • Rtotal = Routside,convection + Rdrywall + Rinsulation + Rhariboard + Rair pocket + Rsiding +Rinside,convection
2 x 4 Stud, 1 x 1 m2 Section: Theoretical vs. Simulation Heat Flux • Heat flux for each insulation and temperature difference was calculated next with Solidworks and compared to the theoretical calculations done.
2 x 4 Stud, 1 x 1 m2 Section: FEA (January) 0.042 W/m2·ºC 0.03 W/m2·ºC 0.046 W/m2·ºC
2 x 4 Stud, 1 x 1 m2 Section: FEA (April) 0.042 W/m2·ºC 0.03 W/m2·ºC 0.046 W/m2·ºC
2 x 4 Stud, 1 x 1 m2 Section: FEA (July) 0.042 W/m2·ºC 0.03 W/m2·ºC 0.046 W/m2·ºC
2 x 6 Stud, 1 x 1 m2 Section: R-values • Next Step: How does the heat flux change when more insulation is added with a 2 x 6. • The R-values were calculated again when a thicker insulation.
2 x 6 Stud, 1 x 1 m2 Section: Theoretical vs. Simulation Heat Flux • Here are the heat flux numbers for the SolidWorks simulations compared to the theoretical calculations done:
2 x 6 Stud, 1 x 1 m2 Section: FEA (January) 0.042 W/m2·ºC 0.03 W/m2·ºC 0.046 W/m2·ºC
2 x 6 Stud, 1 x 1 m2 Section: FEA (April) 0.042 W/m2·ºC 0.03 W/m2·ºC 0.046 W/m2·ºC
2 x 6 Stud, 1 x 1 m2 Section: FEA (July) 0.042 W/m2·ºC 0.03 W/m2·ºC 0.046 W/m2·ºC
Conclusions from Theoretical and SolidWorks Studies of 1 x 1 m2 Section • Based upon this data, fiberglass is the insulation to choose. The heat flow through the section of wall is the lowest compared to the other insulation choices.
3 Sections of Wall with 2 x 4 Studs: Overview Studs • The next step: A bigger section of wall with studs included. • The R-values had to be calculated for the sections of wall next to the studs and next to the insulation. Hardiboard Insulation Drywall Plywood
3 Sections of Wall with 2 x 4 Studs: FEA (January) 0.03 W/m2·ºC 0.046 W/m2·ºC 0.042 W/m2·ºC
3 Sections of Wall with 2 x 4 Studs: FEA (April) 0.03 W/m2·ºC 0.046 W/m2·ºC 0.042 W/m2·ºC
3 Sections of Wall with 2 x 4 Studs: FEA (July) 0.042 W/m2·ºC 0.03 W/m2·ºC 0.046 W/m2·ºC
Duct Insulation: Overview • Next step: Determine what size fiberglass insulation is best • Assumptions: • Air flowing through is 22.2 °C • Air surrounding duct is the temperature of the outside since placed in attic • Three fiberglass insulation size choices of 2 inches, 4 inches and 6 inches. • The analysis in Solidworks was performed on a three foot section of duct. Fiberglass insulation Reflective Barrier Air Flow Aluminum Core
Duct Insulation: R-values • For a cylinder, the equation for the total r-value changes. It is dependent on the radius of each section of material.
Duct Insulation: FEA Simulation (January) January Analysis: Temperature flow through the center at 22.2 ºC and the surrounding temperature 2.778 ºC 2 inches 4 inches 6 inches
Duct Insulation: FEA Simulation (April) April Analysis: Temperature flow through the center at 22.2 ºC and surrounding temperature at 15.56 ºC 2 inches 4 inches 6 inches
Duct Insulation: FEA Simulation (July) July Analysis: Temperature flow through the center at 22.2 ºC and the surrounding temperature 27.2ºC 2 inches 4 inches 6 inches
Attic Insulation: Overview • Next Step: Which insulation is the best choice for the attic • Assumptions: • Attic temperature is the outside temperature • Inside temperature is 22.2 °C Insulation Drywall
House Model: Overview • Next Step: Move from a small section of wall or attic to a full wall or ceiling. • Each section of wall was simulated separately and then the heat flux of all were added together.
House Model: FE Analysis • Here are the results for the heat flux traveling through each wall of the house model.
House Model: FEA Simulation Right and Left Walls
House Model: FEA Simulation • Front Wall
Quantitative Results • Insulation Type (30%) • Duct Thickness (36% compared to 20%) • Stud Sizing (~30%)
Future Work • Determine thermal conductivities for each insulation • Find quantitative difference of heat flux for different insulation choices • Compare cost difference between insulations with energy savings or loses