Download
1 / 37
380 likes | 626 Views
From Asymmetric Exclusion Processes to Protein Synthesis. Beate Schmittmann Physics Department, Virginia Tech. with Jiajia Dong (Hamline U.) and Royce Zia (Virginia Tech), and many thanks to Leah Shaw (William & Mary). Workshop on

E N D
From Asymmetric Exclusion Processes to Protein Synthesis Beate Schmittmann Physics Department, Virginia Tech with Jiajia Dong (Hamline U.) and Royce Zia (Virginia Tech), and many thanks to Leah Shaw (William & Mary). Workshop on Nonequilibrium dynamics of spatially extended interacting particle systems January 11-13, 2010 Funded by the Division of Materials Research, NSF
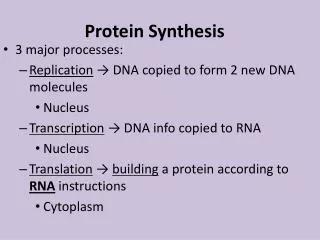
Basic facts about protein synthesis • A simple model: TASEP with locally varying rates • Currents and density profiles for one and two slow codons • “point” particles • “extended” objects • Real genes • Conclusions and open questions Outline:
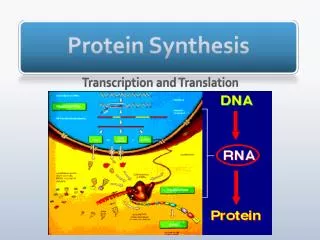
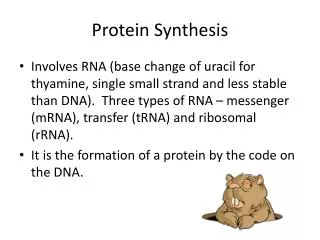
Protein synthesis • Two steps: • Transcription: DNA RNA • Translation: RNA Protein Image courtesy of National Health Museum
http://cellbio.utmb.edu/cellbio/rer4.jpg initiation elongation termination • A ribosome… • starts at one end (initiation) • goes to the other, “knitting” the amino acid chain (elongation) • releases aa-chain at the end and falls off mRNA (termination) • Before one falls off, • another one starts! Shine-Dalgarno, Kozak
Knitting the aa into the polypeptide chain Left: http://www.emc.maricopa.edu/faculty/farabee/BIOBK/BioBookglossE.html Right: cellbio.utmb.edu/cellbio/ribosome.htm; also Alberts et al, 1994
Some interesting features: • In E. coli, 61 codons code for 20 amino acids, mediated by 46 tRNAs • tRNA concentrations can vary by orders of magnitude • Translation rate believed to be determined by tRNA concentrations Synonymous codons code for same amino acid;Degeneracy ranges from 1 to 6 “Fast” and “slow” codons
Example: Leucine in E. Coli tRNA codon H. Dong, L. Nilsson, and C.G. Kurland, J. Mol. Biol. 1996
In E. coli, 61 codons code for 20 amino acids, mediated by 46 tRNAs • tRNA concentrations can vary by orders of magnitude • Translation rate believed to be determined by tRNA concentrations Some interesting features: Synonymous codons code for same amino acid;Degeneracy ranges from 1 to 6 “Fast” and “slow” codons • Codon bias: In highly expressed genes, “fast” codons appear more frequently than their “slower” synonymous counterparts
Translation is a one-dimensional, unidirectional process with excluded volume interactions • Suggests modeling via a totally asymmetric exclusion process Towards a theoretical description:
… … Totally asymmetric simple exclusion process • Open chain: • sites are occupied or empty • particles hop with rate 1 to empty nearest-neighbor sites on the right • particles hop on (off) the chain with rate () • random sequential dynamics (easily simulated!) The model: TASEP of point particles • Ring: much simpler The proto model: F. Spitzer, Adv. Math.5, 246 (1970)
Why study TASEP ? • Mathematicians: “Consider… this stochastic process” • Biologists: simple minded model for protein synthesis • Physicists: • Non-equilibrium statistical mechanics • Interacting systems with dynamics that violate detailed balance, time reversal • Novel states and stationary distributions • Many other potential applications
… … • Non-zero transport current – mass (energy, charge, …) • Open boundaries • Coupled to two reservoirs • Simplest question: Properties of non-equilibrium steady state? • Answer: Solve master equation! (T)ASEP: Far from equilibrium !
… … 1 Max J High High: Low: Max: 1/2 Low 1/2 1 MacDonald et al, 1968; Derrida et al, 1992, 1993; Schütz and Domany 1993; many others • P*(C)can be found exactly: • density profiles, currents, dependence on system size • non-trivial phase transitions! Note on pbc TASEP of point particles: • Phase diagram:
Translation is a one-dimensional, unidirectional process with excluded volume interactions • Suggests modeling via a totally asymmetric exclusion process Towards a theoretical description: • Modifications: • Translation rates are spatially non-uniform; start with one or two slow codons, then consider a whole gene • Ribosomes are extended objects (cover about 10 – 12 codons); start with point- likeobjects, then consider different sizes (A.Kolomeisky, 1998; Chou & Lakatos, 2004) (L.B.Shaw et al, 2003, 2004) • Goal: Explore the effect of “bottle necks” (rates, location) and xxxribosome size
q q … … x y • To model the effects of one or two slow codons: • change hopping rates locally to q 1 • for simplicity, choose = = 1 TASEP with bottle necks: • Measure current ( protein production rate) and density profile: • as a function of x, y and q
Simulations… • Without slow site: System is in max current phase: • With slow site: Left/right segment in high/low density phase …except for q 0.7 One slow site: Particles – holes : N = 1000 q = 0.2; centered Edge effect! Density profile:
Simulations… N = 1000, q = 0.6 Current: Density profiles: Edge effect: site A.Kolomeisky, 1998 Mean-field theory: Maximized at q=0.49: 2.5% k=1: good results from FSMFT
Simulations… … and extension of MFT Particles – holes: Two slow sites: L = 1000; q1 = q2= 0.2; separated by 500 sites Typical density profiles: q1 = q2= 0.2 q1 = q2= 0.6
Chou and Lakatos, 2004 Current vs separation: Current reduction vs q: Current is sensitive to separation: q1 = q2= 0.6 q Significant effect!
Chou and Lakatos, PLR 2004;Dong, Schmittmann, Zia JSP 2007 First set of conclusions: • To maximize current, i.e., protein synthesis rate: Note: • Slow codons should be spaced as far apart as possible! • Check effect of particle size! • Two slow sites with q1q2: Slowest site determines current • Fast site(s) : Significant effects on profiles; none on currents
… … Effect of particle size,l • Entry: • – only if first lsites are free; then, whole particle enters with rate • Hopping: • – left-most site is “reader”, determines local rate • Exit: • – hops out gradually, “reader” leaves with rate β Lakatos and Chou, JPA 36, 2027 (2003): Complete entry and incremental exit
McDonald and Gibbs, 1969; Lakatos and Chou, 2003; Shaw et al., 2003 1 Results based on mean-field analysis or extremal principle; no longer exact but in good agreement with simulations. Max J Phase diagram: High Low 1 • High: • Low: • Max:
Edge effect! Long tails! Simulations… N = 1000, q = 0.2,x = 82 • Without slow site: System is in max current phase. • With slow site: Left/right segment in high/low density phase l= 01l= 06l = 12 One slow site: Coverage density profile (all occupied sites) Reader density profile (only sites occupied by readers)
Simulations… Current reduction vs q: Edge effect:
Simulations… N = 1000, q = 0.2 l= 01 l=02l= 06l = 12 Shock still develops! Two slow sites: Coverage density profile: Reader density profile:
Simulations… Current reduction vs q: Current is sensitive to separation:
Second set of conclusions: • The basic conclusion of the point particle study remains valid: • Currents are maximized if slow codons are spaced as far apart as possible. • Edge effect becomes more dramatic, as l increases • Real genes?
From TASEP to protein production: Lattice Site Particle Hopping rate γi Current J mRNA template Codon Ribosome tRNA cellular concentration Protein production rate
Protein required to initiate chromosome replication • 467 codons, 138 (30%) are sub-optimal A real gene: dnaA in E. coli Raw tRNA abundances:
highest wild wildlowest ~ 1.5 ~ (138 replacements) (225 replacements) Optimize:
2.8% 2 slowest: 17% 10 slowest: Optimize: Clustering!
Introduce “coarse-grained” rate: Clustering is important: • K 1is time needed to traverse lconsecutive sites Shaw, Zia, and Lee PRE 2003
K12min = 0.441 K12min = 0.699 K12min = 0.255 K12 measure:
Simulated currentJMCvs. K12 min Fully Optimized Best linear fit throughOWSand the origin Wild (“original”) Totally Suppressed Both fits provide tolerable and simple estimates for the J ’s 700 other sequences Best linear fit through OWS
??? J ~const. K12 min Simulated currentJMCvs. K12 min Similar results for 10 other genes in E.coli Example of lacI : (with just 5 other randomly generated sequences) Slopes are ~10% of each other. DNA-binding transcriptional repressor
Conclusions: • Protein production can be increased significantly by a few xxtargeted removals of bottlenecks and clustered bottlenecks. • K measure provides simple estimate of changes in production rates • Extensions: Initiation-rate limited mRNA; finite ribosome xxsupply; polycistronic mRNA; parallel translation of multiple xxmRNAs; and many other issues. • Experiments! J.J. Dong, B. Schmittmann, and R.K.P. Zia, J. Stat. Phys.128, 21 (2007); Phys. Rev. E 76, 051113 (2007); J. Phys. A42, 015002(2009) J.J. Dong, PhD thesis. Virginia Tech (May 2008)