Download
1 / 10
0 likes | 10 Views
Water being elixir of life and have unique properties like surface tension, cohesion and ability to dissolve a wide range of substances, contribute to its importance in supporting life on Earth. Freshwater ecosystem provides water supply for versatile purposes such as drinking, sanitation, irrigation and various economic sectors. The Freshwater ecosystem is grouped into several categories i.e., rivers, lakes, waterfalls, wetlands, streams, reservoirs and ponds. Even though we have these abundant sources of water bodies the real challenge lies on the accessibility to Clean,

E N D
1 Int. J. Biomol. Biomed. International Journal of Biomolecules and Biomedicine (IJBB) ISSN: 2221-1063 (Print), 2222-503X (Online) http://www.innspub.net Vol. 18, No. 2, p. 1-10, 2024 REVIEW REVIEW REVIEW REVIEW PAPER PAPER PAPER PAPER OPEN ACCESS OPEN ACCESS OPEN ACCESS OPEN ACCESS Seasonal impact on physico-chemical parameters of fresh water resources- A review M. Manonmani1, TA. Sathya2, R. Anburaj3, K. Gokilavani4, PS. Geethanjali4, S. Viswanathan*5 1Post Graduate and Research Center, Department of Microbiology (Government Aided), Sri Paramakalyani College, Alwarkurichi, Tamilnadu, India 2PG & Research Department of Microbiology, Vivekanandha College of Arts and Sciences (Autonomous) for Women, Elayampalayam, Tiruchencode, Tamilnadu, India 3PG and Research Department of Biotechnology, Microbiology and Bioinformatics, National College (Autonomous), Tiruchirappalli,Tamil Nadu, India 4Vivekanandha College of Arts and Science for Women (Autonomous) Elayampalayam, Tiruchencode, Tamilnadu, India 5Post Graduate & Research Centre of Microbiology, Sri Paramakalyani College, Alwarkurichi, Tamilnadu, India Key words:Fresh water, Seasonal changes, Physico-chemical parameters and impact Article Published: 06 April 2024 Abstract Water being elixir of life and have unique properties like surface tension, cohesion and ability to dissolve a wide range of substances, contribute to its importance in supporting life on Earth. Freshwater ecosystem provides water supply for versatile purposes such as drinking, sanitation, irrigation and various economic sectors. The Freshwater ecosystem is grouped into several categories i.e., rivers, lakes, waterfalls, wetlands, streams, reservoirs and ponds. Even though we have these abundant sources of water bodies the real challenge lies on the accessibility to Clean, safe and adequate freshwater in the aquatic ecosystem. Among all these aforesaid water bodies rivers, lake and wetlands are considering as vital for human beings for multiple purposes and it need to be conserved and protected. In order to control the fresh water from getting polluted we need to gather reliable information’s on water quality for the effective supervision of water resources. The excellence of Fresh water can simply affect by the Waste disposal, anthropogenic-induced changes and Seasonal Variations, which lead various negative features to the living welfare. This constant disintegration of fresh water, its needs to be protected from further deterioration by regularly monitoring and evaluating the water and its qualities. On this front, we need to identify perpetual water using different physicochemical parameters and biological properties and regulate the aptness of water. This paper thrives to get knowledge about the influence of seasonal changes on physico-chemical parameters and Microbiological parameters on fresh water. *Corresponding Author: S Viswanathan drsvmicro@gmail.com Manonmani et al.
2 Int. J. Biomol. Biomed. Introduction Water is a solitary unique and key resource which is found in around about 75% of the earth’s crust. Quality water shall steer us to a healthy environment for all the living things and natural resources in the world (Kumar et al., 2017). In the entire world water resources and their quality are playing a paramount role in our day to day life. Water being an elixir and inevitable product of human life and habitats it has now become an endangered component due to Fig. 1. Some important causes of water quality proliferating contamination. decrement Water bodies contain diverse range of floating, In many developing countries research works are to dissolved, suspended and biological as well as be conducted and significant contribute to examine pathological impurities but, nowadays it has become the excellence of water through the physic-chemical more vulnerable to contamination due to human parameters of water and study their various biological activities and natural disasters. So before using the aspects by adopting advanced techniques (Cuffney et water, apart from checking the physical appearance al., 2014). By analyzing the various water quality such as color, taste, temperature, pH, turbidity, etc., parameters, we shall be able to understand whether while chemical tests also should be performed for it’s harmful to agricultural and industrial purposes, identifying its Biological oxygen demand, Chemical water portability, the pollutants found in aquatic oxygen demand, Dissolved oxygen, alkalinity, base, understanding the life style presence and hardness and other characters (Bhateria et al., 2016) distortion of aquatic flora & fauna in the aquatic .Mainly water resources can be categorized into three environment (Li et al., 2010). types (Fresh water, Surface water and Ground water). Among these three, the fresh water resources are A river is a natural flowing watercourse, which is mainly used for all biotic and a biotic factor in our considered as one of the most important freshwater living system. Freshwater shall be any naturally ecosystem (Tabari et al., 2010).Seasonal changes in occurring liquid or frozen water which includes river, lake, pond, waterfalls (Madilonga et al., 2021). rivers will extremely alter the different chemical, Freshwater Biodiversity is also under severe threat biological, and physical properties of water and as a result it will affect our healthy natural ecosystem and due to seasonal variations and day today activities of ecological process (Iqbal et al., 2019). Thus, human (Albert et al., 2020). Due to these seasonal monitoring a specific issue in river and fresh water variations, every year the quality of water can quality lies in the difficulty related to the analysis and gradually be decreased across the world and also its conserve their resources become on challenges (Shil leads both optimistic and harmful impacts on the et al., 2019). superiority of water (Beck et al., 2012). Due to these seasonal impacts all physical and chemical The main purpose of our studies was to critically parameters of water can be varied and it may lead to review and acclaim the physical, chemical, and precarious impacts to the living systems. Considering biological aspects of aquatic quality through standard the fact that we need to ensure clean and safe parameters and how they varied with seasonal environment we need to monitor and evaluate the changes by using various research works and quality of water in many organized methodologies. publications. Based on that, we can easily find out the The following (Fig. 1) shows what are the common factors that can affect the fresh water quality (Dey et current status of fresh water and the compatible al., 2021). parameters for analyzing each fresh water sources. Manonmani et al.
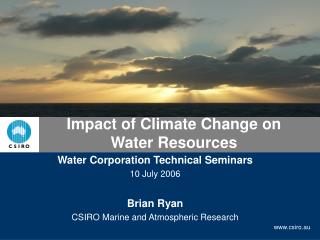
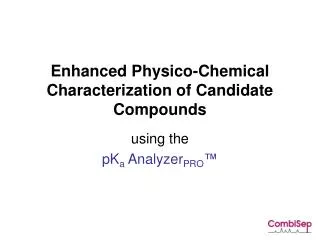
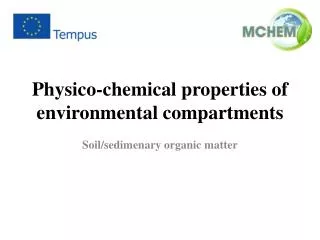
3 Int. J. Biomol. Biomed. Studies on seasonal changes on fresh water changes in fresh water are interlocked with the effects on biodiversity, aquaculture, coastal areas, and people Rainfall is the chief cause of fresh water, which fills (Dey et al., 2021). It is an adverse and highly impact up freshwater habitats such asPonds, lakes, rivers, able problem in most of the developing countries and streams. In India we have a large amount of fresh including India (Miller et al., 2017). water resources and among them rivers play a major part in our country (Fig. 2). The characteristics of fresh water change seasonally. Seasons have three different group such as (Maansi et al., 2022). Such as Pre-monsoon (January -April), Monsoon (May-September) and Post-monsoon (October-December). Such variations have a severe impact on the worsening of the quality of fresh water, which in turn brings about larger variations in the physicochemical and microbiological parameters of fresh water (Toraskar et al., 2022). Fig. 2. Fresh water sources in INDIA (https://www.mapsofindia.com/water/) In this review, we focused on seasonal changes (Pre- monsoon and Post-monsoon) of various fresh water resources like lake, pond, wet land and river which was located in and around India and also reviewed their impact on physico –chemical parameter of fresh water. Table 1 shows the various physico-chemical parameters (pH, Temperature, electrical conductivity, TDS, DO, Phosphate then Nitrate) of various fresh water resources. Fig. 3. Permissible value and method of some physico-chemical parameter The following (Fig. 3) shows some important permissible level of physico chemical parameters of In India we have around 60 river basins out of water quality (Sharma et al., 2021). As per the which we have 12 major river basins and 48 standard values of BIS (BIS et al., 2012), and CPCB medium river basins (lakes, ponds, wetland’s etc.,). (CPCB 2008), by using standard methodsAPHA, Out of these major and medium river basins we are AWWA, WEF (APHA, AWWA, WEF 1998). selecting ten fresh water research works for our Changes on microbiological parameter study and analyze the seasonal impact on physico– chemical and biological parameter of fresh water Water resource is an important requirement for sources. The water testing process can be made on microbial growth (Babic et al., 2020). Fresh water seasonal basis against a set of certain pre- must be sufficiently biostable and should be free from requisites with which the biggest threat of microbial impacts so as to aid the growth of living diminishing and deterioration of fresh water things in aquatic environs. The permissible value of microbes in water is 100 -500 CFU and these resources can be restored (Elayaraj et al., 2015). parameters may vary due to seasonal changes. These seasonal changes may lead to various health issues Changes on physico-chemical parameter and illness to the humans and aquatic life forms ( The daily water demands for domestic, agricultural, Schurer et al., 2021).Bacteriological analysis of water and industrial activities are fulfilled by the natural to indicate the nature of pollution in water so that it is fresh water bodies (e.g., rivers, lakes, wetlands, considered important( Sharma et al., 2013). ponds, etc. (Eliku et al., 2018). The causes of seasonal Manonmani et al.
4 Int. J. Biomol. Biomed. Table 1. Impact of seasonal changes on physico–chemical parameters in fresh water SL Fresh water Sources Season pH Tem. (0C) Electrical conductivity (μS/cm) 273.67 250.67 - - 195.23 189.58 TDS (mg/L) DO (mg/L) Phosphate (mg/L) Nitrate (mg/L) Reference 1. Varuna Lake, India lakes of Chota Nagpur, India. Lake Sukhna, Chandigarh, India River Ganga, India. River Cauvery, India Pre –monsoon 8.18 Post monsoon 8.98 26.92 Pre –monsoon 8.04 Post monsoon 7.32 Pre –monsoon Post monsoon 30.73 142.67 5.28 139.50 5.27 - - 190.50 2.78 150.23 3.56 <0.1 <0.1 0.16 0.19 0.02 0.03 0.59 1.40 3.95 2.98 2.00 1.01 Abhilash et al., 2022 Lal et al., 2022 Jindal et al., 2022 2. 17.57 18.33 21.0 23.0 5.17 4.27 3. 8.5 8.3 4. Pre –monsoon Post monsoon Pre –monsoon6.5 -8.5 6.5 7.o 30 32 - 700 550 - - 3.0 3.5 6.0 7.5 6 0.03 14.5 9 Kar et al., 2022 Sharma et al., 2021 5. Within the permissible value Within the permissible value 196.28 231.56 387.00 629.75 690.00 Within the standards Post monsoon >8.5 - 220.00 6.0 0.14 Within the standards 6. Wetlands of Punjab, India. tropical wetland, Sundarbans, India aquaculture pond, Dhanbad, India. Doyang River, Nagaland, India. 10. Ganga River system, Uttarakhand, India (Note: DO- Dissolved oxygen, TDS- Total Dissolved Solids, DO- Dissolved Oxygen) Pre –monsoon Post monsoon Pre –monsoon 7.72 Post monsoon 7.37 7.7 8.4 23.5 20.82 32.1 25.1 200.00 4.72 478.50 8.12 170.00 5.32 206.00 5.80 0.27 0.3 0.39 0.33 0.3 0.2 0.014 0.009 Singh et al., 2022 Gogoi et al., 2019 Pall et al., 2018 Sing et al., 2022. Matta et al., 2020 7. 8. Pre –monsoon 6.91 Post monsoon 7.69 - - 610.8 598.4 317.00 3.09 298.00 4.06 0.8 0.6 8.06 7.10 9. Pre –monsoon 8.09 Post monsoon 6.93 Pre –monsoon Post monsoon - - 188.67 155.05 138.15 131.15 93.95 10.56 79.17 269.22 8.89 283.04 9.18 - - 0.65 0.72 - - 9.03 - - 16.40 16.03 0.06 0.08 Table 2. Impact of pH on fresh water SL 1. 2. 3. 4. 5. 6. pH parameter More than 12 More than 11 More than 8 Above 4 to 5 Below 4 Below 2.5 Causes hair fibers to swell Eye irritations, skin, and mucous membranes Salty water Affect aquatic life Redness, irritation to eyes Epithelium get damaged irreversibly Reference (Gupta et al., 2017). (Sudarshan et al., 2019) The potability of microbiologically polluted water, sample and their ranges can varied seasonally may lead to Diarrhoeal diseases and influence about (Dhanalakshmi et al., 2018). 2.2 million deaths and one billion illnesses per year (WHO, 2011; Kapembo et al., 2016). The Impact on physical-chemical parameter on water microbiological analysis of the water sample shows quality the presence of coliforms in it. Presence of Fecal Examination of the physicochemical quality of water Coliforms and total coliforms indicates that the water parameters plays a pivotal role in assessing the might have got contaminated with human sewage, quality of water and restoring water quality in the animal droppings and organic loads (Ghildyal et al., environment (Whitehead et al., 2018; Islam et al., 2019). These contaminated water bodies have huge 2018). When industrial waste, domestic waste, and amount of microorganisms in it such as Salmonella agricultural drainage waste are diversified with the sp., Shigella sp., E. coli, Vibrio cholera, Pseudomonas water, they could be easily polluted (Barakat et al., sp, Aeromonas hydrophilia, Enterobacter cloacae 2016). In general, some of the mentioned parameters and Legionella are observed to be maximum in water should be monitored for checking the polluting nature Manonmani et al.
5 Int. J. Biomol. Biomed. of fresh water or river water, including water lower oxygen in it and pollutants may become more temperature, pH, dissolved and suspended solids, toxic at high temperature. turbidity, dissolved oxygen, compounds of phosphorus and nitrogen, biochemical oxygen Turbidity demand, and chemical oxygen demand (Gupta et al., The permissible turbidity level of water is 1.0 NTU. 2017). The quality of water and freshwater habitats get affected by the increase in turbidity in water. The high pH turbidity of water sources can become a harbor for pH is stand as negative logarithm of hydrogen ion microbial pathogens like bacteria, algae, etc., concentration in water (pH = -log (H+)). The (Hoellein et al., 2014). Permissible pH level of water lies within the range 7– 8.5 (USEPA, 1986). A decreased carbon dioxide Electrical conductivity concentration will, in turn, raise the pH level, whereas Conductivity used to measure the presence of an increase in carbon dioxide concentration will cause inorganic materials in water, and when these the pH level to drop. Changes in pH affect the most inorganic minerals are dissolved in water in high chemical and biological processes in water. The amounts, it also indicates the presence of total anthropogenic human activities also change the water dissolved solids in the water. It is considered essential sources to be more acidic often than basic (Zaghloul physical pollution indicators and also measures the et al., 2019). The following (Table 2) shows the quality of aquatic biota in water resources (Manjula et Impact of pH on freshwater. al., 2019). Monitoring the level of pH in water is used to check TDS and TSS the corrosivity of water. The lower pH level will The existence of organic matter and inorganic salt will indicate the highest level of corrosion. In addition, pH represent the presence of TDS and TSS in water. levels can affect the degree of corrosion of metals as Permissible TDS level in water is 500 mg/L.Both TDS well as disinfection efficiency; they may also have an and TSS are used to evaluate the amount of indirect effect on the health of human beings and biologically inert organic matter (lignin, etc.,) in habitats (Chabukdhara et al., 2012). water. Presence of dissolved salt shall change the entire aquatic life which in turn leads to animal skin Temperature dehydration. The higher levels of total suspended Presence of temperature in aquatic eco systems solids will automatically increase the water normally fluctuates between day and night and varies temperature and decreases the level of oxygen which from season to season. The measurement of creates an unfavorable environment for aquatic life temperature should be monitor periodically for all (Prabha et al., 2020). aquatic based research work. The Permissible temperature level of water 25 to 30°C (Dheenan et al., Biological Oxygen Demand (BOD) 2014).With the help of this parameter, we can easily In aquatic ecosystem under aerobic condition the identify the various natures of water bodies. There are microorganism decompose the organic matter for various other parameters like alkalinity, salinity, their survival. The presence oxygen level is direct electrical conductivity, BOD and COD are having proportional to the amount of microorganism present direct impact based on the water temperature. In in it. BOD level in water reflects the quantity of aquatic system the flora and fauna can also be easily dissolved oxygen in all water resources. So it is affected by the temperature (Zaghloul et al., 2019). considered as one of the most significant pollutant The sequel of variation in temperature may affect the aquatic plant photosynthesis process by creating indicator in water. The Permissible BOD level of Manonmani et al.
6 Int. J. Biomol. Biomed. water is 2.0 mg/L. The increased level of BOD Nitrate During organic matter degradation and the use of indicates the occurrence of untreated effluents from chemical fertilizers, nitrate is released. Nitrate is one industrial and domestic users. This effluent water of the essential nutrients to plants. The Permissible contains huge amount of organic pollutants and nitrate level of water is 45.0 mg/L. While nitrate itself releases toxic element in water. These organic is not typically harmful to humans at low levels, high pollutants present in the effluents will consume the concentrations of nitrate in drinking water can pose dissolved oxygen and detoriates the aquatic eutrophication, changes in aquatic plants and environment oxygen level. Hence, presence of lesser animals, and health risks, particularly to infants and oxygen level in water will lead to death of fish and pregnant women (Jorgensen et al., 2014). other aquatics biotas which indicate the poor quality of river (Bi et al., 2021). Conclusion In this study, the physico-chemical parameters of Chemical Oxygen Demand (COD) fresh water can be varied in both the pre-monsoon COD is a measure of the amount of oxygen required and post-monsoon periods. As per the standard to oxidize organic and inorganic matter in water. It's a values of pH, temperature, electrical conductivity, critical parameter in evaluating water quality, total dissolved solids, dissolved oxygen, phosphate, particularly in wastewater treatment and and nitrate, changes in these parameters influence environmental monitoring. The permissible COD the decreasing quality of fresh water for the entire level in water is 30.0 mg/L. Untreated waste water aquatic living biota as well as human usage. These effluents contain large amount of organic compounds changes occur due to high population, urban like NO3, Fe salts, and sulfide. These untreated waste development and improper waste disposal of toxic water effluents will contaminate the fresh water effluents. These activities should be controlled and ecosystem once it conjoins. The measurement of COD monitored periodically otherwise it may contaminate the water, which may result in unsuitable for in water will help us to determine the toxicity level drinking, agricultural and industrial purpose. This and presence of organic matter in water. High levels study may help us to regulate and screen the fresh of COD in water, always gives a negative water quality according seasonally. environmental and regulatory consequences to the water (Jeff et al., 2015) The above study shows us the huge impact of Physico- chemical and Biological properties of fresh water Phosphate sources due to seasonal variations and the abnormal Entry of phosphorous in aquatic system is occurred growth of microorganisms which in turn affects the by anthropogenic activity of human and natural health of human beings, aquatic livestock’s and disasters, because human being and nature possess habitats. These adverse effects will impact the long lot of phosphorous sources. The Permissible term survival and healthier environment adversely. phosphorous level of water is <0.2 mg/L. The We are in a critical stage of rectifying these impacts in discharge of Phosphorous loads contained in waters an organized and scientific methods for a better will increase the higher growth rate of algae blooms, aquatic environment which always have direct and macrophysics and this accelerated plant growth result indirect impacts on human beings and habitats. in reduced water quality in the form of eutrophication in water. Increased phosphorous lead the low DO References (dissolved oxygen), change the pH level in water and Abhilash HR, Mahadevaswamy M. 2022. A it is dangerous to the entire living biota and affects Study on Physico-Chemical Parameters and Water the whole food web of aquatic life (Spellman et al., Quality Index (WQI) of Varuna Lake, Mysore, 2014; Water, U.N., 2011). Karnataka, India. Indi J Nat Sci. 12, 0976-0997. Manonmani et al.
7 Int. J. Biomol. Biomed. Albert JS, Destouni G, Sylvester SM, Boyacioglu H. 2006. Surface water quality assessment using factor analysis. Wat SA 32(3), 389- Magurran AE, Oberdorff T, Reis RE, 393. Winemiller KA, Ripple WJ. 2020. Scientists’ warning to humanity on the freshwater biodiversity Chabukdhara M, Nema AK. 2012. Assessment of crisis. Ambio 50, 85-94. heavy metal contamination in Hindon River sediments: a chemometric and geochemical APHA, AWWA, WEF. 1998. Standard methods for approach. Chemosphere 87(8) 945-953. the examination of water and wastewater. Washington, D.C., USA: American Public Health CPCB. 2008. Environmental Standards, Water Association, American Water Works Association, Quality Criteria. Central Pollution Control Board, World Environment and Federation 20. New Delhi, India. Babic MN, Gostincar C, Cimerman NG. 2020. Cuffney T, Kennen J, Waite l. 2014. Waite Microorganisms populating the water-related indoor Aquatic ecosystems as indicators of status and trends biome. Appl. Microbiol. Biotechnol. 104, 6443-6462. in water quality. DOI: 10.1016/B978-0-12-382182-9.00008-6. Barakat A, Baghdadi ME, Rais J, Aghezzaf B, Slassi MM. 2016. Assessment of spatial and Dey S, Botta S, Kallam R, Angadala R, seasonal water quality variation of Oum Er Rbia River Andugala J. 2021. Seasonal variation in water (Morocco) using multivariate statistical techniques. quality parameters of Gudlavalleru Engineering International Soil and Water Conservation Research College pond. Cur.Res. in Green and Sus.Chem. 4, 4, 284-292. 100058. Beck MW, Claassen AH, Hundt PJ. 2012. Dey S, Botta S, Kallam R, Angadala R, Environmental and livelihood impacts of dams: Andugala J. 2021. Seasonal variation in water common lessons across development gradients that quality parameters of Gudlavalleru Engineering challenge sustainability. Int. J. River Basin Manag.10 College pond. Current Research in Green and (1), 73–92. Sustainable Chemistry 4(1), 100058. Bhateria1 R, Jain D. 2016.Water quality Dhanalakshmi B, Chitra G, Soundharya T. 2018. assessment of lake water: a review Sustain. Water Assessment of microbial quality in water, sediment and Resour. Manag. 2, 161–173. fish tissue- A Health concern approach in lotic freshwater body, Ambarampalayam River, Tamilnadu, Bi S, Wang L, Li Y, Zhang Z, Wang Z, Ding X, India. Int. J. RecSci Res. 9(7), 27751-27755. Zhou JA. 2021. Comprehensive Method for Water Environment Assessment considering Trends of Dheenan PS, Jha DK, Vinithkumar NV, Water Quality. Hindawi. Advan. Civil Engin 8. Ponmalar A., Venkateshwaran P, Kirubagaran R. 2014. Spatial variation of physicochemical and Birk S, Chapman D, Carvalho L, Spears BM, bacteriological parameters elucidation with GIS in Andersen HE, Argillier C. 2020. Impacts of Rangat Bay, Middle Andaman. India. Journal of Sea multiple stressors on freshwater biota across spatial Research 85, 534–541. scales and ecosystems. Nat EcolEvol 4, 1060–1068. Elayaraj B, Selvaraju M. 2015. Seasonal BIS. 2012. Indian Standards Specification for Variations in Physico-Chemical Parameters of Sri Kamatchiamman Temple Pond Chidambaram Taluk, Drinking Water. IS: 10500.Bureau of Indian Tamilnadu. J Environ Treat Tech. 3(2), 126-133. Standards, New Delhi, India. Manonmani et al.
8 Int. J. Biomol. Biomed. Eliku T, Leta S. 2018. Spatial and Seasonal Jiang S, Wang F, Li Q, Sun H, Wang H, Yao Z. Variation in Physicochemical Parameters and Heavy 2021. Environment and food safety: a novel Metals in Awash River, Ethiopia. App Wat Sci. 8 177 integrative review. Environ Sci Poll Res. 28, 54511– 54530. Ghildyal D. 2019. Study of seasonal variations between coliforms and biochemical oxygen demand Jindal MR, Wats M. 2022. Evaluation of surface (BOD) in Hindon River: a statistical approach. Int water quality using water quality indices (WQIs) in Res J SciEng 7(4), 81–91. Lake Sukhna, Chandigarh, India. Applied Water Science 12(1). Gogoi P, Sinha A, Sarkar SD, Chanu TN,Yadav AK, Koushlesh SK, Borah S, Das SK, Das BK. Jorgensen S, Serenson BH. 2014. Drugs in the 2019. Seasonal influence of physicochemical environment. Chemo 40(7) 691–699. parameters on phytoplankton diversity and assemblage pattern in Kailash Khal, a tropical Kapembo M L, Laffite A, Bokolo MK, Mbanga wetland, Sundarbans, India App Wat Sci. 9, 156. AL, Vangua M, Otamonga JP,. Mulaji CK, Mpiana PT, Wildi W, Pote J. 2016. Evaluation of Guhathakurta P, Khedikar S, Menon P, Prasad Water Quality from Suburban Shallow Wells Under AK, Sable ST, Advani SC. 2020. Observed Rainfall Tropical Conditions According to the Seasonal Variability and Changes over West Bengal State. Variation, Bumbu, Kinshasa, Democratic Republic of Climate Research And Services India Meteorological Congo. Expo Hea 8(4), 487-496. Department Ministry Of Earth Sciences Pune; Met Monograph No.: ESSO/IMD/HS/Rainfall Variability/ Kar S, Ghosh I, Chowdhury P, Ghosh A, Aitch 29 53. P, Bhandari G, Chowdhury AR. 2022. A model- based prediction and analysis of seasonal and tidal Gupta, N, Pande P, Hussain J. 2017. Effect of influence on pollutants distribution from city outfalls physico-chemical and biological parameters on the of river Ganges in West Bengal, India and its mapping quality of river water of Narmada, Madhya Pradesh, using GIS tool. PLOS Water 1(2), e0000008. India. Water Sci 31(1), 11-23. Kumar A, Sharma MP, Taxak AK. 2017. Analysis Hoellein T, Rojas M, Pink A, Gasior J, Kelly J. of water environment changing trend in Bhagirathi 2014. Anthropogenic litter in urban freshwater tributary of Ganges in India. Desalination and Water ecosystems: distribution and microbial Interactions. Treat. 63, 55–62. Plos one. 9. Lal A, Lal N. 2022. Influence of Monsoon on quality Iqbal K, Ahmad SDutta V. 2019. Pollution of water in lakes of Chota Nagpur plateau, North mapping in the urban segment of a tropical river: Is Eastern India. Sustainability Agri. Food Environ. Res. water quality index (WQI) enough for a nutrient- 11. polluted river. Appl. Water Sci. 9(8), 197. Islam JB, Akter S, Bhowmick AC, Uddin MN, Li X, Dong S, Zhao Q, Liu S. 2010. Impacts of manwan dam construction on aquatic habitat and Sarkar M. 2018. Hydro-environmental pollution of community in middle reach of Lancang River. Pro. Turag River in Bangladesh. Bangladesh J. Sci. Ind. Environ. Sci. 2(5) 706– 712. Res. 53(3), 161-168. JeffC, Michalak M. 2015.Challenges in tracking Lkr A, Sing MR, Puro N. 2020. Assessment of harmful algal blooms: a synthesis of evidence from water quality status of Doyang River, Nagaland, Lake Erie. J Great Lake Res. 41(2) 317–325. India, using Water Quality Index App Wat Sci. 10, 46. Manonmani et al.
9 Int. J. Biomol. Biomed. Maansi R, Jindal, Wats M. 2022. Evaluation of Rossel V, Fuente ADL. 2015. Assessing the link surface water quality using water quality indices between environmental flow, hydropeaking operation (WQIs) in Lake Sukhna, Chandigarh, India. App Wat and water quality of reservoirs. Ecol. Eng. 85, 26–38. Sci. 12(2). Schurer R, Hijnen WA, Wal A. 2021. The Madilonga RT, Edokpayi JN, Volenzo ET, significance of the biomass subfraction of high-MW Durowoju OS, Odiyo JO. 2021. Water Quality organic carbon for the microbial growth and Assessment and Evaluation of Human Health Risk in maintenance potential of disinfectant-free drinking Mutangwi River, Limpopo Province, South Africa. Int. water produced from surface water. Wat. Res 209, J. Environ. Res. Public Health. 18(13), 6765. 117898. Manjula P, Warrier CU. 2019. Evaluation of water Sharma A, Bora CR, Shukla V. 2013. Evaluation quality of Thuthapuzha Sub-basin of Bharathapuzha, of Seasonal Changes in Physico-chemical and Kerala, India. App WaSci 9, 70. Bacteriological Characteristics of Water from the Narmada River (India) Using Multivariate Analysis. Matta G, Nayak A, Kumar A, Kumar P. 2020. Natural Resources Research. 22. 10.1007/s11053-013- Water quality assessment using NSFWQI, OIP and 9204-x. multivariate techniques of Ganga River system, Uttarakhand, India. App WatSci 10, 206. Sharma TR, Ravichandran C. 2021. Appraisal of seasonal variations in water quality of river Cauvery Miller GT, Spoolman SE. 2017. Environmental using multivariate analysis. Wat. Sci 35(1), 49–62. Science, Cengage Learning India Pvt. Ltd, New Delhi, India. Shen X, Shi Y, Kong L. 2021. Particle number emissions from light-duty gasoline vehicles in Beijing, Pall D, Maiti SK. 2018. Seasonal variation of heavy China. Sci Total Environ. 773, 145663. metals in water, sediment, and highly consumed cultured fish (Labeo rohita and Labeo bata) and Shil S, Singh UK, Mehta P. 2019. Water quality potential health risk assessment in aquaculture pond assessment of a tropical river using water quality of the coal city, Dhanbad (India). Environ Sci. Pollut index (WQI), multivariate statistical techniques and Res Int. 25(13), 12464-12480. GIS. Appli. Water Sci. 9, 168. Prabha AS, Ram A, Irfan ZB. 2020. Exploring the Singh Y, Sing G, Khattar JS, Barinova S, Kaur relative water scarcity across the Indian million-plus J, Kumar S, Singh DP. 2022. Assessment of water urban agglomerations: An application of the Water quality condition and spatiotemporal patterns in Poverty Index. Hydro Res 3, 134–145. selected wetlands of Punjab, India. Environ Sci Poll Res 29(2), 2493 – 2509. Rajeswari A, Christy E, Mary G. 2019. Cellulose acetate based biopolymeric mixed matrix membranes Spellman F. 2014. Handbook of water and with various nanoparticles for environmental wastewater treatment plant operations. Taylor and remediation-a comparative study. J Environ Francis group 1(3) 4665-5385. ChemEng. 7, 103278. Sudarshan P, Mahesh MK, Ramachandra TV. Reid AJ, Carlson AK, Creed IF, Eliason EJ, 2019. Assessment of Seasonal Variation in Water Gell PA, Johnson PT. 2019. Emerging threats and Quality and Water Quality Index (WQI) of Hebbal persistent conservation challenges for freshwater Lake, Bangalore, India. J Environ Eco. 37, 309-317. biodiversity. Biol. Rev. 94, 849–873. Manonmani et al.
10 Int. J. Biomol. Biomed. Tabari H. 2020. Climate change impact on flood and Whitehead PG, Bussi G, Hossain MA, Dolk M, extreme precipitation increases with water Das P, Comber S, Peters R, Charles KJ, Hope availability. Sci. Rep. 10(1), 1-10. R, Hossain S. 2018. Restoring water quality in the Toraskar AD, Manohar CS, Fernandes CL, Ray polluted Turag-Tongi-Balu river system, Dhaka: Modelling nutrient and total coliform intervention D, Gomes AD, Antony A. 2022. Seasonal strategies. Sci. Total Environ. 1, 631- 632, 223 -232. variations in the water quality and antibiotic WHO. 2011. (World Health Organisation) Guidelines resistance of microbial pollution indicators in the Mandovi and Zuari estuaries, Goa, India. Environ. for drinking water quality. Monit. Assess. 194(2), 71. Zaghloul A, Saber M, Dewany CE. 2019. USEPA. 1986. Ambient water quality criteria for Chemical indicators for pollution detection in bacteria (Washington: U.S. Environmental Protection terrestrial and aquatic ecosystems. Bull Natl Res. Agency, EPA440/5–84–002). Cent. 43, 156. Wang L, Luo D, Liu X. 2021. Effects of PM2.5 Zaghloul A, Saber M, Hady AE. 2019. Physical exposure on reproductive system and its mechanisms. Chemosphere 264(Pt 1), 128436. indicators for pollution detection in terrestrial and Water, U. N. Policy brief: water quality. aquatic ecosystems. Bull Natl. Res. Cent. 43, 120. United Nations 2011. http://www.unwater.org/ downloads/water quality_ policy brief. pdf Manonmani et al.