Download
1 / 1

E N D
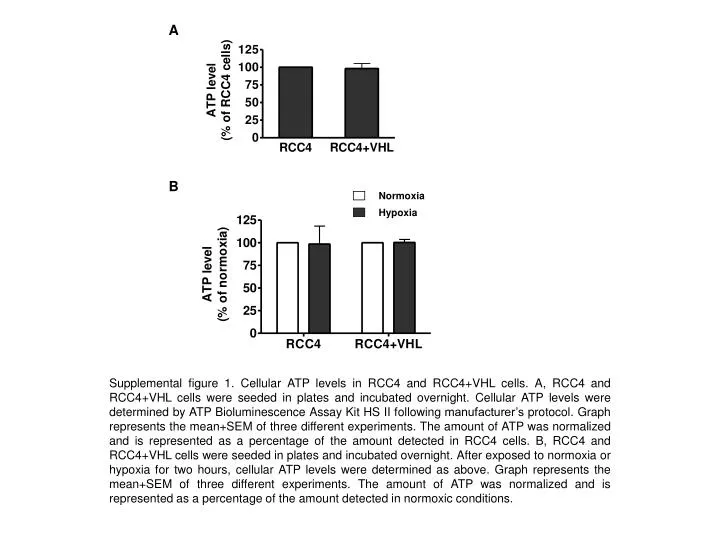
A B Normoxia Hypoxia Supplemental figure 1. Cellular ATP levels in RCC4 and RCC4+VHL cells. A, RCC4 and RCC4+VHL cells were seeded in plates and incubated overnight. Cellular ATP levels were determined by ATP Bioluminescence Assay Kit HS II following manufacturer’s protocol. Graph represents the mean+SEM of three different experiments. The amount of ATP was normalized and is represented as a percentage of the amount detected in RCC4 cells. B, RCC4 and RCC4+VHL cells were seeded in plates and incubated overnight. After exposed to normoxia or hypoxia for two hours, cellular ATP levels were determined as above. Graph represents the mean+SEM of three different experiments. The amount of ATP was normalized and is represented as a percentage of the amount detected in normoxic conditions.