Download
1 / 28
280 likes | 524 Views
Welcome to World Geography!. Using Maps. Compasss Rose/Directional Indicator Legend/Key Scale. Basic Map Components. AKA: directional indicator Shows cardinal directions N, S, E, W Often indicates intermediate directions NE, SE, SW, NW. Compass Rose. AKA: Key

E N D
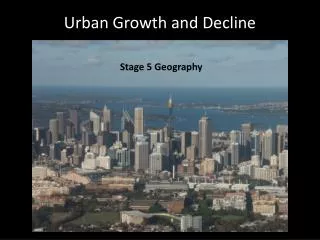
Welcome to World Geography! Using Maps
Compasss Rose/Directional Indicator Legend/Key Scale Basic Map Components
AKA: directional indicator • Shows cardinal directions • N, S, E, W • Often indicates intermediate directions • NE, SE, SW, NW Compass Rose
AKA: Key • Tells about symbols used on the map Legend
Tells about the size of a map in relation to the size of the real world • How? • Gives the ratio between distances on the map and actual distances on the earth • Shown in both miles (mi) and kilometers (km) Scale
Parallels of Latitude Meridians of longitude The Global Grid
Latitude and longitude are imaginary lines forming a grid covering the whole globe • Every place on earth has a unique position on the grid The Global Grid
AKA: Parallels • Why? • The lines run parallel to the EQUATOR • Every place has a specific latitude • 0 degrees latitude= Equator Lines of Latitude
AKA: Meridians • Run from pole to pole • Cross the lines of latitude • Every place on earth has a specific longitude • 0 degrees longitude= • Prime Meridian (Greenwich Meridian) Lines of Longitude
What does a map legend indicate?Tells the user about the symbols used on the map.What are the four cardinal directions?North, South, East, and WestIn what directions do meridians of longitude run?North and SouthLines of latitude?East and West
Globe: the MOST ACCURATE method of showing the entire surface of the earth • What are possible problems of carrying a globe around with you? Displaying Information
Cartographers • mapmakers • Map projections • Ways of showing the earth on a flat page • Distortion • A twisting out of normal shape or form. • A lack of correspondence of size or intensity in an image or object Terms
What problem do cartographers face?Representing our round planet on a flat page.What are map projections?Efforts to make the best possible representation with the least distortion.
Great Circle • An imaginary line that circles the earth, creating two EQUAL hemispheres • Airplanes often use great circle routes to save fuel and to reduce travel time. Great Circle Routes
loxodrome • curve cutting the meridians of a sphere at a constant nonright angle. Thus, it may be seen as the path of a ship sailing always oblique to the meridian and directed always to the same point of the compass. Pedro Nunes, who first conceived the curve (1550), mistakenly believed it to be the shortest path joining two points on a sphere (see great circle route). Any ship following such a course would, because of convergence of meridians on the poles, travel around the Earth on a spiral that approaches one of the poles as a limit. On a Mercator projection such a line ( rhumb line) would be straight. Rhumb lines are used to simplify small-scale charting • Encyclopedia Britannica, 2008. Encyclopedia Britannica Online. Trivia Time!
One of the most simple yet most distorted projections • Why? • Images at the poles are spread in order to flatten the globe • This makes areas at the poles larger than they really are • Shapes are more accurate, but areas and sizes are not Mercator Projection
Less size and shape distortion • Areas at the poles appear flatter than they really are • Land on eastern and western edges are fairly accurate in size and shape Robinson Projection
What is the most accurate way to display information about the earth?A globe.What is another name for a cartographer?Mapmaker.What route do pilots take in order to save fuel and reduce travel time?Great circles.What is the advantage of a Robinson projection?Maps have less size and shape distortion.
General Purpose Special Purpose • Show information that is most often used by readers • Physical • Political • AKA: Thematic Maps • Relay information about specific types of data • Climate • Vegetation • Natural resource use/economic activities • Population density • Population distribution Types of Maps
AKA: Relief maps • Show physical features of an area • Mountains • Rivers • Lakes • Relief-the changing elevation of the land • Colors used: • Green for lower relief • Brown for higher relief • Blue for water bodies Physical Maps
Show political features • Political features are determined by people • State boundaries • National boundaries • Cities • Capitals Political Maps
Climate • General temperature and precipitation patterns • Usually shown in various colors on the map key Special-Purpose Maps
Economic Activities/Natural Resources • Symbols show key locations of activities and resources • Economic activities-ways in which people produce and distribute goods and services Special-Purpose Maps
Population Density • The average number of people living in a given area • Listed per sq mi or sq km Special Purpose Maps
How does a natural resources map show where different resources are found?By using symbols to show key locations of activities and resources.What is the difference between an economic activity and a natural resource?Economic activities-ways in which people produce and distribute goods and servicesNatural resource-item in the environment that people need and value