Download
1 / 12
120 likes | 234 Views
Explore tools for addressing uncertainties and analyzing risks in decision-making processes, including sensitivity analysis and expected values. Learn how to compare outcomes and evaluate probabilities to make informed choices. Dive into examples like irrigation projects to understand the impact of risk and variance on results.

E N D
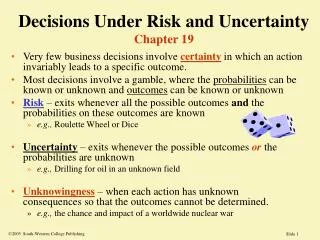
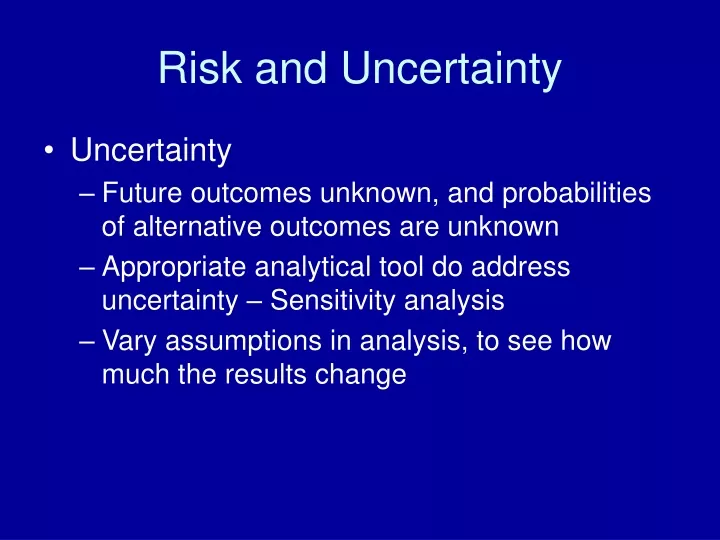
Risk and Uncertainty • Uncertainty • Future outcomes unknown, and probabilities of alternative outcomes are unknown • Appropriate analytical tool do address uncertainty – Sensitivity analysis • Vary assumptions in analysis, to see how much the results change
Analysis of Risk • Risk – Outcomes are unkown, but can estimate probabilities of different outcomes • Contingencies xi (possible States of the world) • Probabilities pi • 0 ≤ pi ≥ 1 • Σi(pi) =1 • Expected outcome (Expected Value): • Σi(pi * xi)
Analysis of Risk • Expected Values of Net benefits under all contingencies • Σi pi * (Bi – Ci) • Need to make sure that contingencies and associated probabilities are appropriately identified. • Spreadsheet example
Analysis of Risk • Projects may increase or decrease level of risk that individuals face • Risk aversion of individuals • ∂U/∂M < 0 (Diminishing Marginal utility of Money) • Compare expected utility from fair bets with certain income • Spreadsheet examples
Expected Utility from Fair Bet (5000 or 1000) Utility Utility Expected Utility from Fair Bet (7000 or 0) Certainty Equivalent Certainty Equivalent Income / Expected Income
Analysis of Risk • EU = EU{E(M) , Var(M)} • EU/E(M) > 0 • EU/Var(M) < 0
U2 E(M) U1 U0 Var(M)
Analysis of Risk • So: • Need to take into consideration effects of project on variance of income. (effect on risk) • If project increases variance of possible outcomes, this should be discounted from benefits • Some projects reduce variations of possible outcomes
Analysis of Risk • Example: Irrigation project • Increases expected return, but also increases variability of return • Increases probability of loss
Analysis of Risk • Traditional system • Cost: $10 • Returns: 50% chance of $12 50% chance of $14 • Profits: 50% chance of $2 50% chance of $4 • Expected profit: .5 (2) + .5 (4) = $3
Analysis of Risk • Irrigation system • Cost: $30 • Returns: 50% chance of $12 50% chance of $80 • Profits: 50% chance of $18 loss 50% chance of $50 profit • Expected profit: .5 (-18) + .5 (50) = $16
Analysis of Risk • Comparison of systems: • Traditional system: • Expected profit = $3 • Variance = 1 • Irrigated system: • Expected profit = $16 • Variance = 2,312 • AND 50% CHANCE OF LOSSES