Download
1 / 25
250 likes | 391 Views
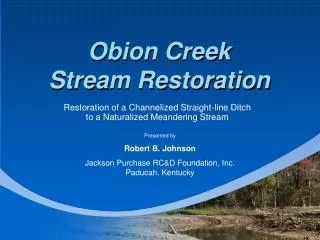
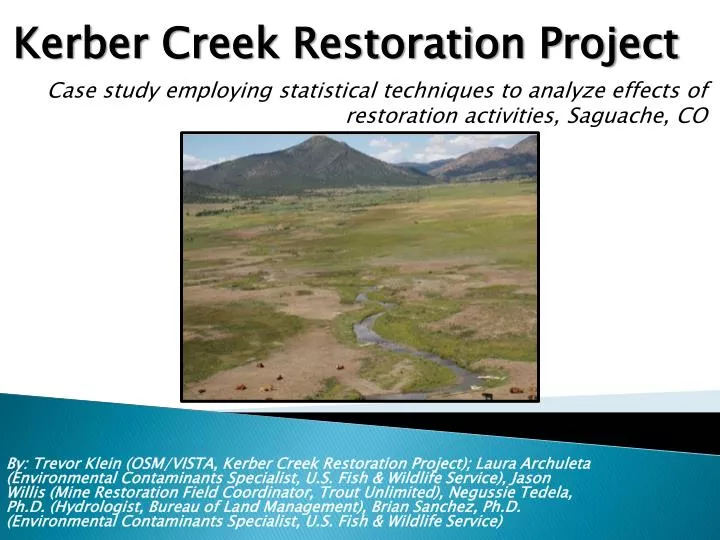
Kerber Creek Restoration Project. Case study employing statistical techniques to analyze effects of restoration activities, Saguache, CO.

E N D
Kerber Creek Restoration Project Case study employing statistical techniques to analyze effects of restoration activities, Saguache, CO By: Trevor Klein (OSM/VISTA, Kerber Creek Restoration Project); Laura Archuleta (Environmental Contaminants Specialist, U.S. Fish & Wildlife Service), Jason Willis (Mine Restoration Field Coordinator, Trout Unlimited), Negussie Tedela, Ph.D. (Hydrologist, Bureau of Land Management), Brian Sanchez, Ph.D. (Environmental Contaminants Specialist, U.S. Fish & Wildlife Service)
Presentation Overview • Introduction: Site History & Study Objectives • Methods: Site Description & Study Design • Results: Presentation of Data • Discussion: Results & Study Errors • Conclusions
Site Location • Northernmost end of Saguache County, CO in the northern San Luis Valley • Tributary to San Luis Creek in the Rio Grande Closed Basin • Kerber Creek watershed is approximately 260 km2 • Includes private and BLM-owned rangeland and Rio Grande National Forest
Bonanza Mining District: A History • 1880s – 1970s (largely ceased by 1930s) • Dozens of silver, lead, zinc, copper mines (largest: Rawley 12) • Tailings originally collected and consolidated in streams and behind dams • Dams destroyed by flood events that carried tailings downstream and deposited them along the stream bank (mid-20th century)
Restoration Efforts, I • 1991: USFS & CDPHE investigate for Superfund designation • 1994: Bonanza Group (ASARCO, Inc., USFS, BLM, Local Landowners) approved to pursue Voluntary Cleanup • 1994-1999: Restoration projects implemented (upper watershed) • 2002: ASARCO, Inc. declares bankruptcy, halting restoration projects Squirrel Creek, 2012 Rawley 12, pre-1996 Squirrel Creek, pre-1992 Rawley 12, 2012
Restoration Efforts, II Kerber Creek Restoration Project Mission: To sustain the health of the Kerber Creek watershed through collaborative restoration projects and community education Methods Phytostabilization: In-situ treatment of mine waste deposits Stream Bank Stabilization: Installation of in-stream rock structures, re-gradation of stream banks Restoration Project Objectives Improve water quality Increase vegetation cover Increase fish density Increase macroinvertebrate density Reduce width/depth ratio Increase sinuosity
Case Study: Problem and Objectives • Systematic, rigorous data analyses rarely conducted for restoration projects • Needs • Comprehensive understanding of project results using easily monitored/derived variables • Further knowledge of stream restoration processes • Evaluate effects of extent of phytostabilization & time on sinuosity • Identify functional relationship between extent of phytostabilization & sinuosity • Assess validity & feasibility of statistical techniques employed Problem Objectives
Presentation Overview • Introduction: Site History & Study Objectives • Methods: Site Description & Study Design • Results: Presentation of Data • Discussion: Results & Study Errors • Conclusions
Site Description • Geology: Dominated by tertiary igneous rock (latite) • Precipitation: Low elevation, 25.4 cm; High elevation, 76.2 cm • Ecology • Vegetation: grasses, willows, sedges • Fishery: brook trout, some brown trout & longnose dace • Hydrology • Avg. high flow: 60 cfs • Avg. base flow: 4 cfs • 100-yr flood: 464 cfs • Geomorphology • Avg. bankfull width: 4.3 – 4.9 m • Avg. bankfull depth: < 0.3 m • Avg. gradient: 3% • Medium-to-large cobble substrate
Measuring Variables, I: Sinuosity Measured remotely using 2005, 2009, 2011 1-m resolution NAIP imagery Sinuosity =
Measuring Variables, II: Extent of Phytostabilization Phytostabilization Index = , where: Hrrepresents hectares of mine waste deposits within floodplain restored, and Ht represents total floodplain acres at site
Statistical Analysis, I: ANOVA • Used to investigate Objective 1 • Repeated measures analysis of variance • Time: Effect of natural channel evolution • Independent Variable: Phytostabilization index treatment levels • Interaction Term: Time BY Phytostabilization index • Dependent Variable: Sinuosity
Statistical Analysis, II: Linear Regression • Used to investigate Objective 2 • Independent Variable: Phytostabilization index • Dependent Variable: Average within sites sinuosity values • No transformations required • Outlier removed: KC15 • Regression Model:
Regression Diagnostics With and Without Outlier Note differences in graphs of Cook’s D statistic vs. observation, studentized residual vs. leverage, sinuosity vs. predicted value, and measures of normality
Presentation Overview • Introduction: Site History & Study Objectives • Methods: Site Description & Study Design • Results: Presentation of Data • Discussion: Results & Study Errors • Conclusions
Results, I: ANOVA • No statistically significant differences; all null hypotheses could not be rejected
Results, II: Linear Regression • Regression coefficient not significant • Adjusted correlation coefficient = 0.357 • No final regression model Sinuosity (unitless) Phytostabilization Index (unitless)
Presentation Overview • Introduction: Site History & Study Objectives • Methods: Site Description & Study Design • Results: Presentation of Data • Discussion: Results & Study Errors • Conclusions
Discussion, IV: Other Considerations • Variable time periods since completion of restoration at each site • Remote sensing-induced errors at KC08
Presentation Overview • Introduction: Site History & Study Objectives • Methods: Site Description & Study Design • Results: Presentation of Data • Discussion: Results & Study Errors • Conclusions
Conclusions • Findings generally inconclusive • Further, more rigorous data collection required • Need to develop more accurate, quantitative measures of extent of restoration • Need to identify appropriate statistical techniques Squirrel Creek, 1990s Squirrel Creek, 2013
Thanks! Trevor Klein, OSM/VISTA Coordinator E-mail: trevorik276@gmail.com Phone: 757-286-2579