Download
1 / 22
220 likes | 336 Views
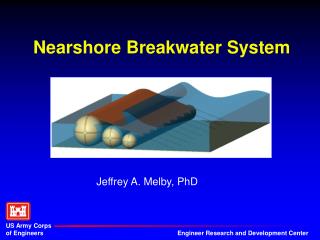
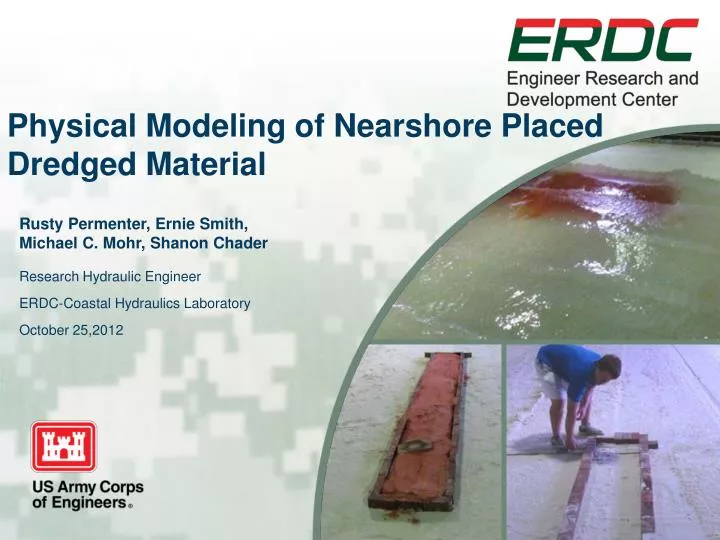
Physical Modeling of Nearshore Placed Dredged Material. Rusty Permenter , Ernie Smith, Michael C. Mohr, Shanon Chader. Research Hydraulic Engineer ERDC-Coasta l Hydraulics Laboratory October 25,2012. Study Motivation.

E N D
Physical Modeling of Nearshore Placed Dredged Material Rusty Permenter, Ernie Smith, Michael C. Mohr, ShanonChader Research Hydraulic Engineer ERDC-Coastal Hydraulics Laboratory October 25,2012
Study Motivation • The U.S. Army Corps of Engineers (USACE) continues to seek opportunities for the beneficial use of dredged material. • Quantify benefits of nearshore dredged mound placement • Determine movement of mound sediment • Provide data for development of C2Shore numerical model
LARGE-SCALE SEDIMENT TRANSPORT FACILITY • Large-scale facility with 18-m wide (cross-shore) by 30-m long (longshore) sand beach (0.15 mm median grain diameter) • Waves produced by four synchronized wave generators oriented at a 10-degree angle to shoreline • Wave-driven currents supplemented by an external recirculation system to simulate infinitely long beach • Longshore sediment transport rate measured with traps installed at the down-drift boundary.
Mound Experiments • Base case scenario was performed to measure the natural movement of sand and to help isolate the influence of each mound • Mounds were located at approximate prototype depths of 11 (Mound 1) and 4 ft (Mound 2) relative to the still water level with a prototype height of 5 ft, and placement onshore (Mound 3) with a 10 ft prototype height. • Each mound was dyed with a different color to increase the contrast between the placed material and the beach • Incident wave conditions simulated at a 1:20 scale for an offshore incident wave height (Hmo) of 10.8 ft with a peak period of 6.7 sec and a breaking wave angle of ~6.5 degrees from shore normal. • Each case was run for a prototype time of ~9 hours.
Test Cases Mound 1 Mound 2 Mound 3
Base Condition Waves
Bathymetry Change Waves Erosion Accretion
Dyeing Sediment • Provided contrast to natural sand • Dyeing Procedure: • Sand mixed with liquid cement color until all sand was of uniform color. • The sand allowed to air dry and subsequently oven-baked at 70 to 80 deg C for a minimum of 24 hours. • After removal from oven, the sand was suitable to be placed on the beach for testing
Mound 1 after 120 minutes T = 0 min T = 120 min T = 0 min T = 120 min
Mound 1 Bathymetry Difference Waves Erosion Accretion
Mound 2 after 120 minutes T = 0 min T = 120 min T = 0 min T = 120 min
Mound 2 Bathymetry Difference Waves Erosion Accretion
Mound 3 after 120 minutes T = 0 min T=120 min T = 0 min T=120 min
Mound 3 Bathymetry Difference Waves Erosion Accretion
Conclusions • Sand placed in the surf zone remained in the surf zone for the given wave conditions • Accretion often occurred onshore of the mound due to sheltering • Mound sand transported downdrift and onshore • Dispersion and mixing occurred quickly for each case